Our impact
Explore case studies from researchers working with communities around the world towards positive change.
Posted on 4 April 2024
A fascinating and far-reaching research project needed a reliable way to spot trees on historic ordnance survey maps, so colleagues in computer science set about finding a solution.
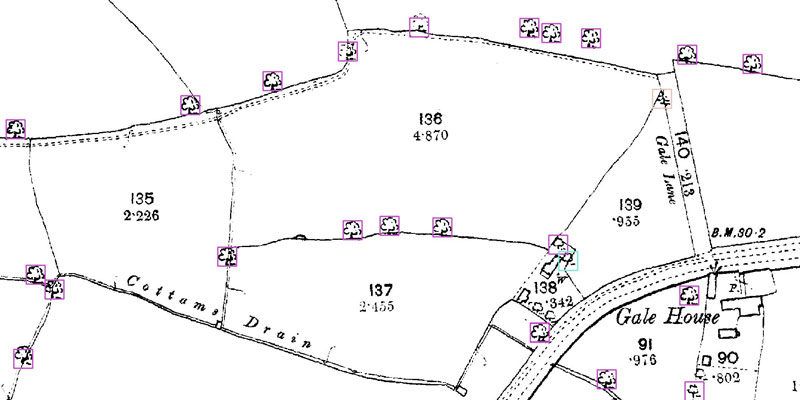
A detail from an early Ordnance Survey map. © Crown Copyright and Landmark Information Group Limited 2024. All rights reserved. 1890-1893.
To count all of those trees would have been an almost insurmountable task, someone would have needed to go over each map centimetre by centimetre. You could never hope to do national-scale mapping like that.
As our understanding of the threats around climate change grows, so too does our appreciation for trees.
For generations, it seems, these staunch woodland stalwarts have been providing shade, locking in carbon, generating oxygen, eliminating erosion and providing habitats for wildlife, while going almost entirely unappreciated by human populations around them.
Quite literally part of the scenery, their ubiquitousness has almost become their undoing. Councils chop them down while providing no plan for their replacement, vandals destroy them and developers clear them by the thousand.
But lately there seems to have been a shift in attitudes. Spurred on by the climate agenda, communities are rediscovering the far-reaching benefits trees can have. As our appreciation of trees reemerges, plans to plant more of them are being discussed throughout the country, and finding the best ways to do this are moving up the political agenda.
Emotive
The ‘Branching Out: New routes to valuing urban treescapes’ is a four-year, half-a-million pound-plus collaboration between the departments of Theatre, Film, Television and Interactive Media; Environment and Geography, Archaeology and Computer Science. Its aim is to provide the best possible knowledge to ensure the right trees are planted in the right places, but understanding how we view and value trees is a complex and emotive issue.
Professor Will Smith, of the Department of Computer Science, describes the project and explains how he played his part.
“We’re rediscovering the importance of planting trees and that means governments are going to spend a lot of money and resources on planting more trees in the UK,” he says.
“So we need data to decide where we plant these trees and to make the right decisions we need to understand the value of a tree.”
But ‘value’ in this case, says Will, goes far beyond the monetary cost of nurturing and planting trees.
“Surprising as it may seem, we already have pretty good models for giving a financial value to a tree,” he explains. “Trees, in effect, provide a service, for example they might store carbon, or provide ground stability, and if they didn’t do that, you have to pay to do it in other ways, which has a measurable cost - so you can give them a value that way.
“But this project is about something a bit more abstract, we’re looking at the social and cultural value of trees.”
Develop
He points out that people can develop strong, emotional bonds with trees, as the recent furore over the destruction of the sycamore tree known as Sycamore Gap in Northumberland, shows. And it’s this difficult-to-define emotional value that the project needs to address.
Says Will: “A conker tree close to a school will have a real community significance because kids will use it to collect their conkers in the autumn. And a tree planted in memory of someone will have a huge significance to some people. Whereas people have little or no attachment to overgrown conifers.”
And that’s the question at the heart of the research: How do people attribute an emotional value to trees?
“Then we can use that data in our planning in relation to what trees we plant and where,” says Will.
As the group lead for the Department of Computer Science’s Vision Graphics and Learning Research group, Will was in an ideal position to deliver on one of the project’s key objectives.
“The project wants to show how UK tree cover has changed over time,” says Will. “Then we can understand changes in land use due to urbanisation, or what trees we’ve lost or where we planted different types of trees and so on.”
So to see these historic changes, it was necessary to see UK tree cover as far back in history as possible. And here they had a stroke of remarkable luck.
“The really cool thing is that the Ordnance Survey created the first set of OS maps in the 1860s and on these maps they even recorded the location of trees,” says Will “So we’ve got these incredibly detailed maps telling up where each tree was. And they did it for the whole of the UK!”
Remarkable
But this remarkable, and massive, resource presented several challenges: the individual trees were only recorded on the very first edition OS maps, which are now well over 200 years old, and not surprisingly their condition varies; meaning that even when digitised the symbols on them vary greatly - and with literally millions of trees recorded, someone was going to have a lot of counting to do.
And that’s where Will’s research would come in. He was brought on board to design a computer system, which would not only recognise and count the tree symbols recorded on these early maps, but also understand the differences between individual trees and multiple sets of trees, like orchards and woods.
Will said: “There were a lot of challenges. For the first edition maps, cartographers would use the same symbol in subtly different ways to denote subtly different things, making the job of recognition that little bit harder. For example, a particular symbol would denote a free-standing tree, whereas the same symbol in a group indicated a wooded region.”
Problems
And the problems didn’t end there. Different tree species might be denoted by different symbols, which, again, could be used in slightly different ways to denote orchards. Not to mention the fact that some of the maps were drawn by hand, and some were extremely faded.
“They’d use these little ink stamps to denote trees,” said Will. “But there's a huge variability in how much ink there’d be on the stamp, and they weren’t always consistent in their use of the symbols.”
But after two years of work, Will has completed a recognition system with the potential to save thousands of hours’ work.
“To count all of those trees would have been an almost insurmountable task,” says Will. “Someone would have needed to go over each map centimetre by centimetre, you could never hope to do national-scale mapping like that.”
The project will continue until 2025 and Will is now involved with integrating the new data into other parts of the project.
He said: “This project focused on York, Milton Keynes and Cardiff and we’re processing that data now, so we’re just considering how this data will integrate with other aspects of the project. We’re also applying for more funding because we’d like to do this on a national scale, and we’ve been contacted by people who can see other uses for it.”
The text of this article is licensed under a Creative Commons Licence. You're free to republish it, as long as you link back to this page and credit us.

William Smith
Research Title: Group Lead, Vision, Graphics and Learning Research Group.
Professor Smith’s research interests span vision, graphics and machine learning. Specifically, physics-based and 3D computer vision, shape and appearance modelling and the application of statistics and machine learning to these areas.
A research project needed to spot trees on historic ordnance survey maps, so colleagues in computer science found a solution.
We’re using gaming technology to ensure prospective teachers are fully prepared for their careers.

A low cost, high-accuracy device, could play a large part in the NHS's 'virtual wards'.
Our monthly research newsletter features a curated mix of news, events, and recent discoveries delivered straight to your inbox.