.jpg)
Low Carbon Infrastructure and Business Growth in North Yorkshire: Sectoral and Business growth
THE CHALLENGE FOR SOCIETY
Historically, North Yorkshire has been at the heart of the industrial revolution in the country. In fact, throughout the years, North Yorkshire’s economic performance has been tied to fishing, agriculture, coal, steel, wool, and shipping industries[1]. However, during the past decades, the North Yorkshire’s economy has undergone fundamental changes. Most notably, economic growth has relied heavily on the retail sector, which has become the dominant industry of the North Yorkshire economy. Mining and quarrying, construction, electricity, and gas, have significantly decreased their share over time, while human health and social work activities have increased their share in the total value added. Today, the challenge is how to achieve decarbonisation targets while continuing to enjoy economic prosperity, which translates into quality of life and at the same time in a healthy planet for future generations to enjoy. See their Local Energy Strategy document.
Over the last few years, a variety of low carbon emissions and economic growth projects and programmes have been put in place in North Yorkshire. Examples of current initiatives include:
- Establishing resource efficiency clusters,
- Creating an energy-smart city of York,
- Supporting towns, rural communities and businesses to benefit from energy independence,
- Creating a circular agri-food sector.
A roadmap towards achieving carbon-negative York & North Yorkshire has been developed, that includes initiatives, such as: Circular Economy Strategy and Action Plan, Yorkshire Hemp Supply Chain mapping, Farm Carbon Footprint, Dynamic Food Platform, Circular Malton, and Yorkshire Circular Economy Living Lab[2]. Thus, achieving the goal of carbon neutrality (SDG 13) is also closely linked to SDG 9 and SDG 12[3].
Economic Trends
In 2018, the total number of employee jobs in Yorkshire and The Humber region across industry sectors was about 2,382,230. Wholesale and retail trade accounted for about 15 percent of total employment, while manufacturing remains the second largest industrial employer contributing about 11 percent of employee jobs. Therefore, the top two industries in employment terms were wholesale and retail, trade and manufacturing. Although real estate activities economically have been growing rapidly, they still constitute less than 5 percent of total employee jobs.
On the other hand, the total number of North Yorkshire businesses in the private sector across industry sectors was estimated at 69,890 in 2018. Approximately 87.5 percent of businesses were micro businesses, while 10.6 percent were small businesses, 1.6 percent were medium, and 0.4 percent were large enterprises. Harrogate and Hambleton had the highest number of businesses in the private sector, accounting for over 30 percent (in terms of number of businesses) of the total businesses population in North Yorkshire. In terms of industry, agriculture, forestry, and fishing had the highest number of businesses in the private sector, followed by wholesale and retail trade, and also by professional, scientific and technical activities.
As identified by the Global Commission on Adaptation Flagship Report[4], when referring to key governance challenges that need to be addressed to enhance the effectiveness of current Climate Change Adaptation strategies, there is a clear necessity to identify and exploit synergies across sectors. According to the report, most of the time public governance systems and processes are organized by sector, often with a good justification for doing so. However, there is a lack of effective structures or procedures in place to share information or experiences and collaborate across sectors regarding climate risk, which translates in obstacles for adaptation. It is expected that by breaking down these sectoral barriers and fragmentation will contribute to efficient solutions in many areas. Thus, the concept of horizontal integration is used in the report to flag the importance of exploiting synergies across sectoral interests. The use of cluster analysis within this study aims to address this challenge, by unveiling some of these cross-sector interactions and relationships.
CO2 EMISSIONS IN NORTH YORKSHIRE
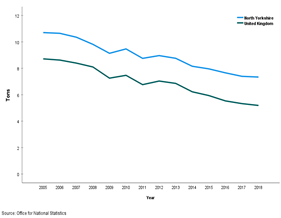
For a long time, North Yorkshire’s per capita emissions have exceeded those of the United Kingdom, but the growth rate decreases at a very similar rate in both places (Figure 1). Covering an area of approximately 3,324 square miles and with a population of 1,158,816 in 2020, North Yorkshire is one of the largest carbon emitters in the Yorkshire and the Humber Region, thus having an important role to play in tackling climate change. Between 2005 and 2018, North Yorkshire’s contributions to the region’s total carbon emissions increased from 11.9 percent to 13.1 percent, which represented the highest increase in the region (Figure 2)
 |
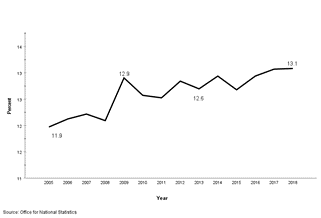 |
Figure 1: Average CO2 emissions per capita in the UK and North Yorkshire, 2005-2018 |
Figure 2: Proportion of North Yorkshire CO2 emissions in Yorkshire and the Humber region |
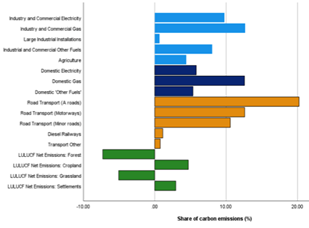
Figure 3 shows the emissions by sector in 2018. The transport sector was the largest carbon emitter in 2018, accounting for 45.3 percent of the total carbon emissions in North Yorkshire. Industry and commercial sector were the second biggest contributor of emissions followed by domestic sector. Croplands and settlements released the lowest amount of carbon dioxide, accounted for 4.7 percent and 2.9 percent of the total carbon emissions, respectively, while forests and grasslands acted as sinks of carbon dioxide, absorbing approximately 4 percent of total emissions from the atmosphere.
There are 28 large industrial installations in North Yorkshire[5]. More than 60 percent of these installations are located in the district of Selby, which produces more than 80 percent of the large industrial emissions in North Yorkshire. As shown in Table 1, the Selby region represents over 86% of the total emissions of NY coming from industrial installations sources, with 26.3 thousand tons.
 |
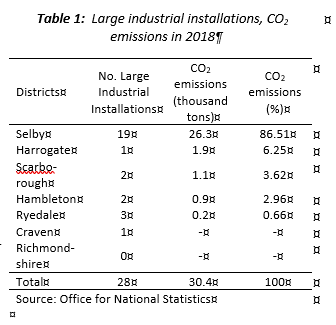 |
Figure 3: Total CO2 emissions by sectors in North Yorkshire from in 2018 |
METHODOLOGY
We use a hierarchical cluster procedure to determine the appropriate number of clusters and identify groups of similar industry sectors. The hierarchical clustering procedure used here is an agglomerative one. It starts by considering every industry sector independently and then gradually puts them together. So, it begins with as many clusters as there are industry sectors and then clusters them naturally by similarity, according to a multidimensional analysis, as detailed below.
We classify sectors based on their value added, number of employee jobs, number of private sector businesses, and levels of carbon emissions. Because these variables are measured in different scales (eg, value added is measured in £millions, employee jobs are measured in units, and carbon emissions in thousand tonnes), we standardized all our variables by calculating their z-scores. We conducted the analysis for 2005-2018, although the cluster analysis was specifically run for the year 2018.
We considered 20 industry sectors. The set of variables we included in our analysis are the gross value added (GVA) in real terms, the number of employee jobs (seasonally adjusted), the number of businesses in the private sector, and tonnes of carbon dioxide emissions. The gross value added is an important measure of the relative size of the industry sector; and the number of business in the private sector includes total enterprises and local units. All these data were linked at industry sector level for North Yorkshire. Our analysis is based on two fundamental assumptions. First, we assume the distribution of emissions across industry sectors in the United Kingdom is approximately equal to the distribution of carbon emissions in North Yorkshire. Second, we assume the structure of workforce jobs in North Yorkshire and the Yorkshire and Humber region are nearly identical.
RESULTS OF ANALYSIS
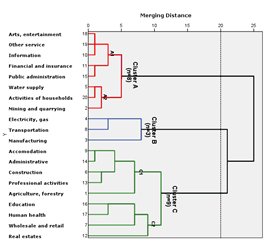
Figure 4 shows the dendrogram for the cluster analysis performed. We identify three different clusters, A, B and C.shows the dendrogram for the cluster analysis performed. We identify three different clusters, A, B and C. Figure 5 shows the composition and size of each cluster (in terms of number of sectors). Within cluster A, sectors such as arts, entertainment, information, and financial activities form sub-cluster A1, while water supply, activities of households, and mining and quarrying form sub-cluster A2. Cluster B includes Electricity, gas, transportation and manufacturing. Finally, within cluster C, sectors such as accommodation, construction, professional services and agriculture and forestry form sub-cluster C1, whereas education, human health, wholesale and retail and real estates form sub-cluster C2.
Note: Cluster A = Low carbon emissions, Low value added, Low level of employee jobs and Low number of private businesses, Cluster B = High carbon emissions, High value added, High level of employee jobs and Low number of private businesses, Cluster C = Low carbon emissions, High value added, High level of employee jobs and High number of private businesses.
 |
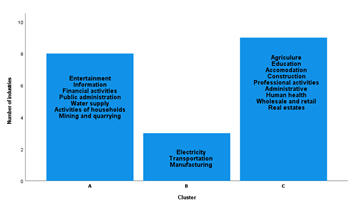 |
Figure 4: 2018 Hierarchical Cluster Dendrogram |
Figure 5: Number of clusters and composition |
Note: Cluster A = Low carbon emissions, Low value added, Low level of employee jobs and Low number of private businesses, Cluster B = High carbon emissions, High value added, High level of employee jobs and Low number of private businesses, Cluster C = Low carbon emissions, High value added, High level of employee jobs and High number of private businesses |
|
[1] Hahn, B. (2020). Technology in the Industrial Revolution. Cambridge University Press; Ashton, T.S. and Sykes, J. (1964). The coal industry of the eighteenth century. Manchester University Press.
[2] LEP program: Greener, Fairer, Stronger – COVID-19 Economic Recovery.
[3] SDG 9: Build resilient infrastructure, promote inclusive and sustainable industrialization and foster innovation. SDG 12: Ensure sustainable consumption and production patterns. SDG 13: Take urgent action to combat climate change and its impacts.
[4] State and Trends in Adaptation Report 2020. Global Center on Adaptation.
[5] National Atmospheric Emissions Inventory https://naei.beis.gov.uk/
RECOMMENDATIONS
This analysis highlights otherwise hidden similarities between sectors, that could be leveraged from a policy perspective. The North Yorkshire County Council could consider the clusters of sectors to adapt their strategies in the long term, considering the political, environmental, social, technological, legal and ethical challenges affecting the UK. First, to evaluate whether the low emitters of CO2 and that bring low value added to the Economy could look for new ways of operating which would be valuable and important. Second, to propose how to better manage the high emitters of CO2 which also bring high value added to the Economy, however, it would be good to ask whether focusing on financial value is too short-sighted? Third, to assess whether low emitters of CO2 and that bring high value added to the Economy should be further encouraged and promoted. Future research avenues could look at generating future policies based on scenarios modelled considering the cluster analysis presented here. Furthermore, it would be good to tackle how can industries within clusters, which are apparently very different, align towards a common strategy to reduce carbon emissions?
About the authors
.jpg)
Dr Luisa Huaccho Huatuco
Research Title: Reader in Operations Management
Luisa’s expertise in manufacturing systems' complexity, contextualises her current research interests at firm and supply chain levels: sustainable supply chains, management of disruptions to distribution/logistics and high value manufacturing.

Graciela Zevallos Porles
Research Title: Associate Faculty, University of East Anglia
Graciela holds a PhD in Economics from the University of East Anglia. Her specialisation is in Experimental Economics and her research interests are on topics that include social and environmental impact.
.jpg)
Juan Ramón Candia
Research Title: Doctoral Researcher
JR's research focuses on climate change adaptation by the private sector and the impact of digital sustainability.