
Publications
Search our research and browse publications in the York Research Database.

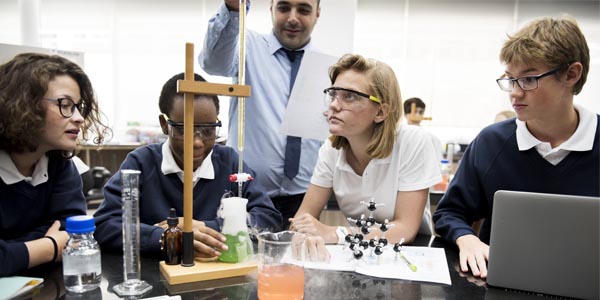
Focusing on practical and policy-relevant issues to improve educational practices and outcomes.


Our four research centres provide an environment for staff and students to generate and test ideas and share expertise. We also conduct cross-cutting studies in several areas, including equality of opportunity, educational evaluation and mental health and wellbeing.


From the Caribbean island of St Lucia to the north of England, Dr Gill Francis' journey to champion the power of education and the role of play has taken her and her daughter across the world.
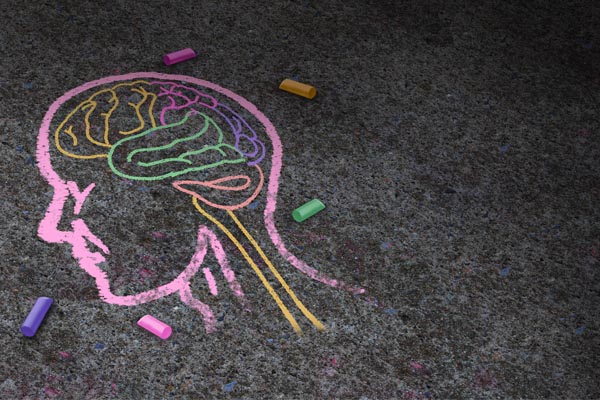
As a developmental-cognitive psychologist, her research focuses on the role of play in child development for neurodivergent and neurotypical children.
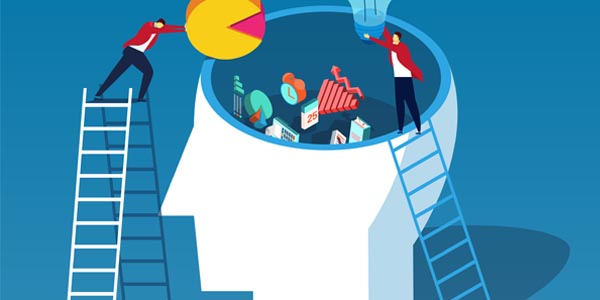
The Technology in Education, Childhood and Youth research cluster critically explores the dynamic intersection between digital technologies and the lives of young people and educators. Our work spans two core themes: the impact and application of Artificial Intelligence (AI) and Information and Communications Technologies (ICT) in learning and communication, and the critical role of digital media in shaping youth wellbeing and social engagement
Bringing together experts in language and science education, developmental psychology, mental health and wellbeing, and social inequality - as well as practitioners - the University of York offers a unique interdisciplinary perspective on the role of technology in education and childhood.
Find out more about Technology in Education, Childhood and Youth

We're raising awareness of the benefits of open science practices and applying this evidence to all educational approaches at different levels, in different ways. Explore EROS
We’re making a real difference in the classroom by enabling teachers to access and implement the best principles emerging from today’s cutting-edge education research.
Best Evidence Science Teaching (BEST) is a set of free research evidence-informed resources for effective teaching of difficult ideas, embedded formative assessment and adaptive lesson planning in science for children aged 11-14 years (KS3).