Who are the fuel poor?
Posted on Thursday 30 March 2023

Summary
In his Autumn budget the Chancellor announced that after April 2023 the Energy Price Guarantee (EPG) would be raised from £2,500 to £3,000 and the £400 rebate to all households would be ended. We produced an analysis of how fuel poverty would rise1. In his Spring budget he had changed his mind and announced the £2,500 Guarantee would remain until July 2023. This paper presents a revised analysis of who will be affected by fuel poverty after April, based on analysis of the ONS Living Costs and Food Survey. We use a threshold of households spending more than 20 per cent of their net income after housing costs on fuel. The analysis describes their characteristics, their fuel poverty rates, their fuel poverty gaps and which households in fuel poverty are not being helped by the mitigations for households receiving social security benefits.
There is clearly an association between fuel poverty and net income, with fuel poverty concentrated in the lower-income deciles, but some richer households also spend more than 20 per cent of their income on fuel and a quarter of households in fuel poverty are not income poor. Childless couple households are less likely than average to be fuel poor, and couples with two or more children and lone parent households are more likely to be fuel poor. Pensioner households are no more likely to be fuel poor.
If there had been no mitigations for social security recipient households, 20 per cent of households would be fuel poor from April 2023. The mitigations will reduce that by 5.2 percentage points or 26 per cent. 68 per cent of all fuel poor households are receiving cost of living payments but that leaves 32 per cent (or 1,768,000) of them not receiving the payments. Households with children are most likely to be at risk after mitigation. The social security mitigations reduce the fuel poverty gap by 26.1 per cent overall, but for those not eligible the mean fuel poverty gap is £31.61 per week.
Background
On 23 January 2023, Jonathan Brearley the Chief Executive of OFGEM said:2
That is why today, as part of the further work on price regulation announced by government in autumn last year, we are calling for a serious assessment of a social tariff. This is a tariff that is set at a different rate for vulnerable customers and protects against the impact of extremely high prices. If it can be made to work, this could tackle the root cause of this issue and the distress that many customers are in this Winter.
Since August 2022, we have been producing papers on household fuel poverty based on the secondary analysis of the ONS Living Costs and Food Survey (LCFS).3 Among these was a paper on social tariffs which compared the impact of a simple progressive social tariff (lower tariffs for smaller consumers paid for either by higher tariffs for larger consumers or by the taxpayer) with policies providing direct support by increasing the incomes of social security recipients. Broadly we concluded that enhancing social security incomes was a better strategy, though far from perfect.4
To summarise: the problems are that not all the fuel poor are small consumers; not all social security recipients are in fuel poverty; not all households in fuel poverty are social security recipients; and neither the government nor fuel providers know who the ‘vulnerable customers’ are.
In this paper we extend and update our previous analyses to identify who the fuel poor will be after April 2023.
1https://cpag.org.uk/policy-and-campaigns/briefing/who-are-fuel-poor
2 J Brearley, ‘Tackling inappropriate energy supplier prepayment meter practices’, Ofgem, 23 January 2023
3 See J Bradshaw and A Keung, ‘Rising fuel poverty’, Poverty, CPAG, 173, 2022, and A Keung and J Bradshaw, ‘Fuel poverty estimates for April 2023 following the Autumn Statement, including social security mitigations’, CPAG, 9 December 2022
4 J Bradshaw and A Keung, Is a social tariff for energy feasible and effective?, University of York, 2022
Methods
Fuel poverty is driven by low income and high energy costs. The latter can be further attributed to high unit cost of energy and poor thermal efficiency of some dwellings. In order to identify which households are most affected by fuel poverty, we use the latest available household data from the ONS Living Costs and Food Survey 2020-21. Chart 1 below shows a significant upward trend of the average energy costs to UK households between 2020 and 2023.
Chart 1: Average weekly energy costs to UK households
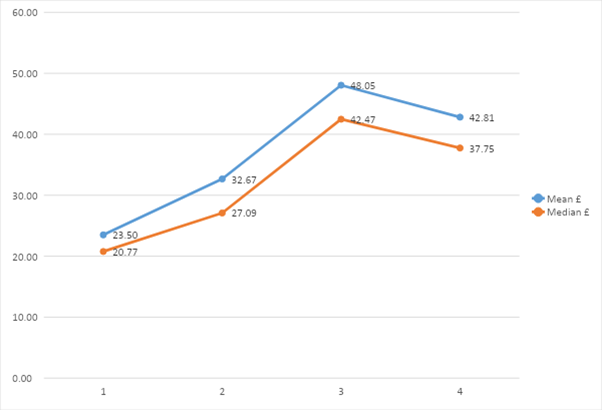
Own analysis of LCFS 2020/21 weighted data
There is no single agreed measure of fuel poverty. Our earlier analyses used a variety of thresholds based on the percentage of net equivalent income spent on fuel (10 per cent, 20 per cent, 25 per cent and 30 per cent). Following convention, we tended to focus on those spending more than 10 per cent on fuel. The End Fuel Poverty Coalition has suggested that these households should be more accurately be referred to as living in ‘fuel stress’, and that fuel poverty should be limited to a higher threshold. In this paper we decided to adopt the 20 per cent definition, using this higher threshold to differentiate the relatively less impacted ‘fuel stress’ households from the more impacted ‘fuel poor’ households.
On 17 November 2022, the Chancellor announced that the Energy Price Guarantee (EPG) would be raised from £2,500 to £3,000 from April 2023 (a decision reversed in the Spring budget) when the £400 per household energy rebate would also end. He also announced that social security benefits and pensions would be uprated by 10.1 per cent and there would be a new set of cost of living (CoL) payments: £300 for all pensioner households, £150 for disability benefit recipients and £900 for recipients of means-tested working-age benefits.
For this analysis we have increased net household income by 10 per cent. This is an attempt to adjust for improvements in net income between September 2020 and April 2023. We have to acknowledge it is only an estimate. Household incomes will have been affected by Covid during 2020/21, especially the £20 per week uplift in Universal Credit (UC). There were upratings of benefits in April 2021 (by 0.5 per cent) and 2022 (by 3.2 per cent), and they will increase again in April 2023 (by 10.1 per cent). Also the minimum wage has been increased faster over this period than general increases in earnings. ONS estimates show that nominal earnings grew by 1 per cent in the year ending April 2020, 5.5 per cent in the year ending April 2021 and 6.9 per cent in the year ending April 2022. But all those increases will have been offset by the £20 per week reduction in UC and/or increases in taxation. Remember we are dealing with net household income.
In this analysis, we have also taken account of the cost of living payments that will be paid through the social security system in 2023-24, though we should acknowledge some limitations: there is a well-known underreporting of benefit receipt in survey data; only around 5 million households received the means-tested benefits eligible for the cost of living payment in the LCFS 2020-21 dataset and the government predicts 8 million will be eligible in 2023-24; there were only around 3 million people in receipt of disability benefits in LCFS 2020/21 and the government predicts 6 million people will be eligible in 2023-24. This discrepancy can also partly be explained by the lack of data in the LCFS on the following eligible disability benefits: Scottish disability benefits, armed forces independence payment, constant attendance allowance, and war pension mobility supplement. However, there does not seem to be any difference between the LCFS and government estimates for pensioner households. The social security mitigations are going to increase income rather than reduce expenditure for those eligible, but for analytical reasons, in order to see their impact on fuel poverty we have adjusted fuel expenditure in the following analysis.
The results show that 20 per cent of households (5.6 million) in the UK in April 2023 will be classified as fuel poor as they will spend more than 20 per cent of their net income after housing costs on their energy bills (before any mitigations).
Results
The first analysis is an exploration of the household characteristics of the fuel poor – what is the composition of households spending more than 20 per cent of net income on fuel? Table 1 shows the composition if there had been no social security mitigations, and after the mitigations.
Table 1: Frequencies distribution of the fuel poor households on key variables, April 2023
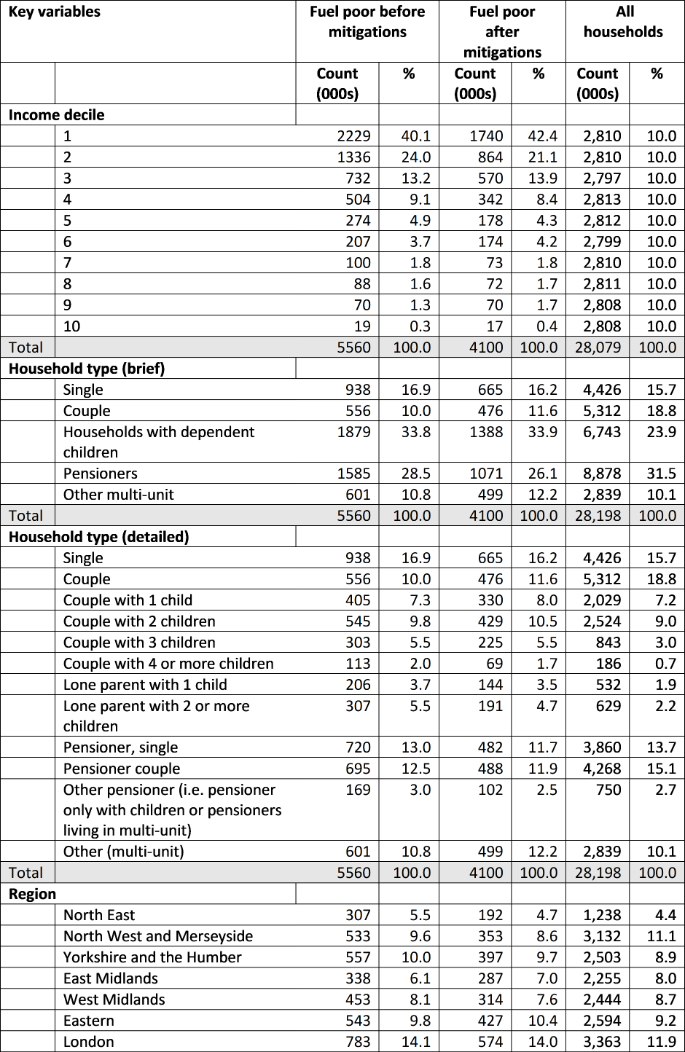
*Cost of living payment
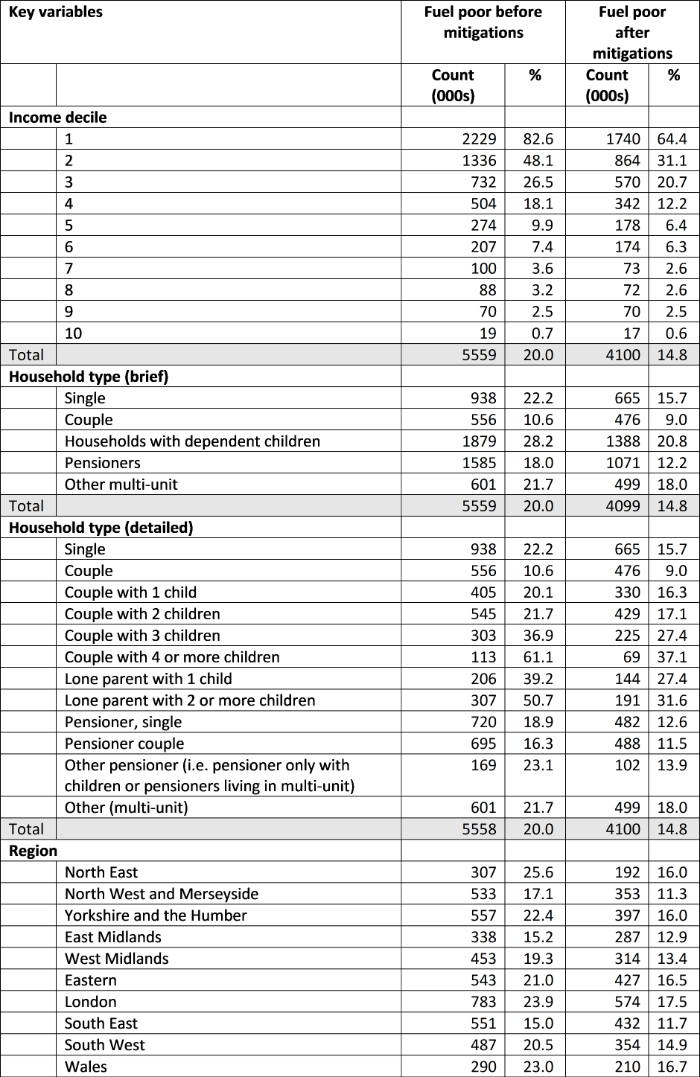
Table 2 presents fuel poverty rates for each household type before and after the social security mitigations. There is clearly an association between fuel poverty and net income, with fuel poverty concentrated in the lower-income deciles, but some richer households also spend more than 20 per cent of their income on fuel and a quarter of households in fuel poverty are not income poor. Childless couple households are less likely than average to be fuel poor, and couples with two or more children and lone parent households are more likely to be fuel poor. Pensioner households are no more likely to be fuel poor. Fuel poverty is more common than average in the North East, Yorkshire and Humberside, Eastern Region, London, Wales, Scotland and Northern Ireland. It is also more common in all non-white ethnic groups and in all rented tenures.
If there had been no mitigations for social security recipient households, 29 per cent of households would be fuel poor from April 2023. The mitigations will reduce that by 5.2 percentage points or 26 per cent.
Table 2: Fuel poverty rates before and after mitigations, April 2023
Who is not eligible for cost of living payments but is fuel poor?
This is an important question because it is an indication of the limits of using the receipt of social security benefits to mitigate fuel poverty, and suggests which might be the types of household that need to be targeted in other ways, including by some kind of social tariff.
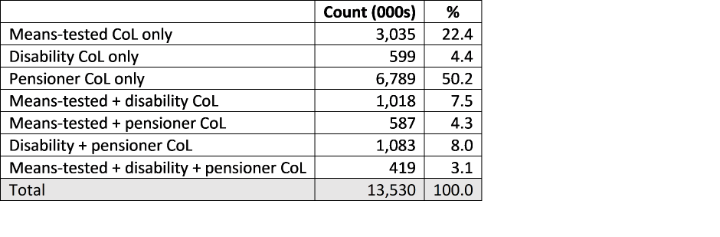
48 per cent of all households receive some mitigation of their fuel costs via the social security system. It can be seen in Table 3 that most of these (66 per cent) are pensioners.
Table 3: Recipients of cost of living payments
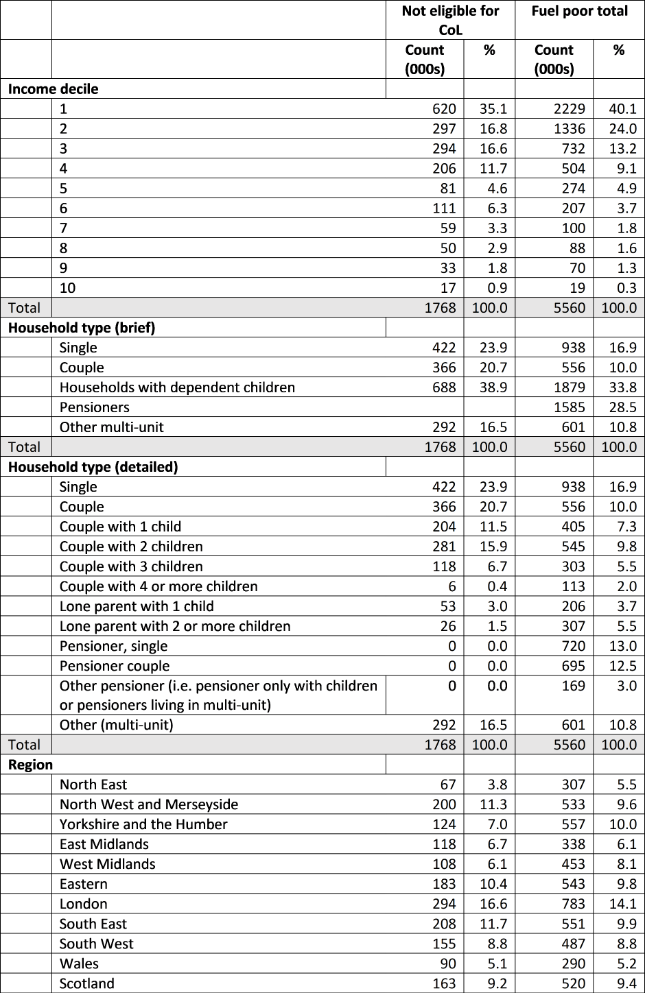
68 per cent of all fuel poor households are receiving cost of living payments but that leaves 32 cent (or 1, 768,000) of them not receiving the payments. Who are they? Table 4 provides an analysis of their composition.
- 69 per cent are from the bottom 3 income deciles
- 39 per cent are families with children
- 59 per cent are living in owned/ mortgaged houses
- 66 per cent are income poor
Table 4: In fuel poverty but not eligible for cost of living payments, April 2023
What happens to the fuel poverty gap?
The fuel poverty gap is an indication of how far below the fuel poverty threshold among those who are in fuel poverty. It is an indicator of the severity of their fuel poverty. Table 5 presents the fuel poverty gap after April 2023, both before and after mitigations. The social security mitigations reduce fuel poverty by 26 per cent on average and of course are of greater value for those eligible. For those not eligible the mean fuel poverty gap is £31.61 (or median £17.85).
Table 5: Mean and median fuel poverty gaps before and after mitigations