Interactive visualisations
For stakeholder engagement
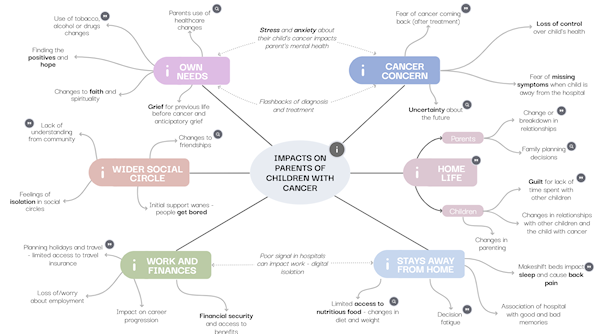
This Interactive visualisations was created using Genially and summarises some of the key impacts that affect parents who are caring for a child with cancer.
The graphic helps users explore how impacts can very between people and includes quotes from parents with experience of cancer.
For presenting evidence synthesis findings
In 2023, researchers at CRD authored a paper on Data visualisation in scoping reviews and evidence maps on health topics: a cross-sectional analysis. In this paper we argue that use of data visualisation is low in scoping reviews and authors could be using much more innovative methods effectively, including interactive visualisation.
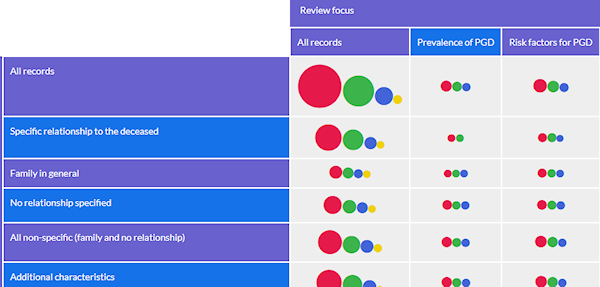
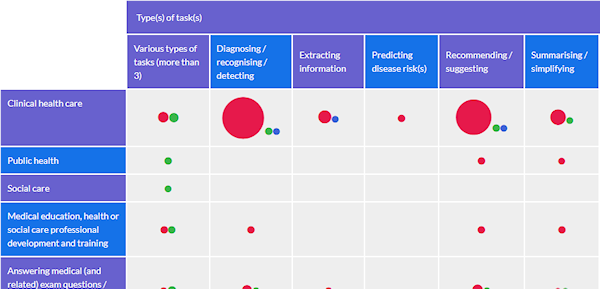
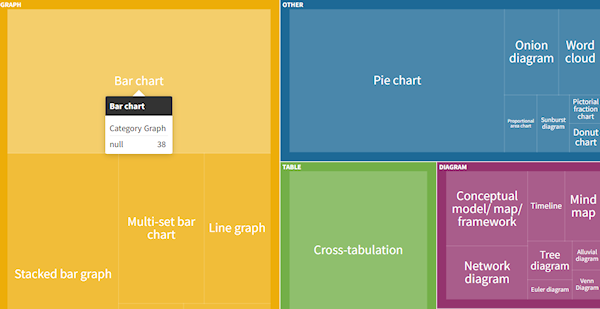
We created the interactive visualisations below as examples of what could be done using software that is both free to access and easy to use and therefore presented few barriers to use for other review authors. They present the data from the study on how data visualisation is used in a sample of scoping reviews, although their main intended function is as an example of how data could be presented. Users can dig down from the higher levels of classification to the individual records or vice versa, depending on their interests.
To create the visualisations we used Flourish, which is a free and easy to use platform.
For presenting evidence and evidence gap maps
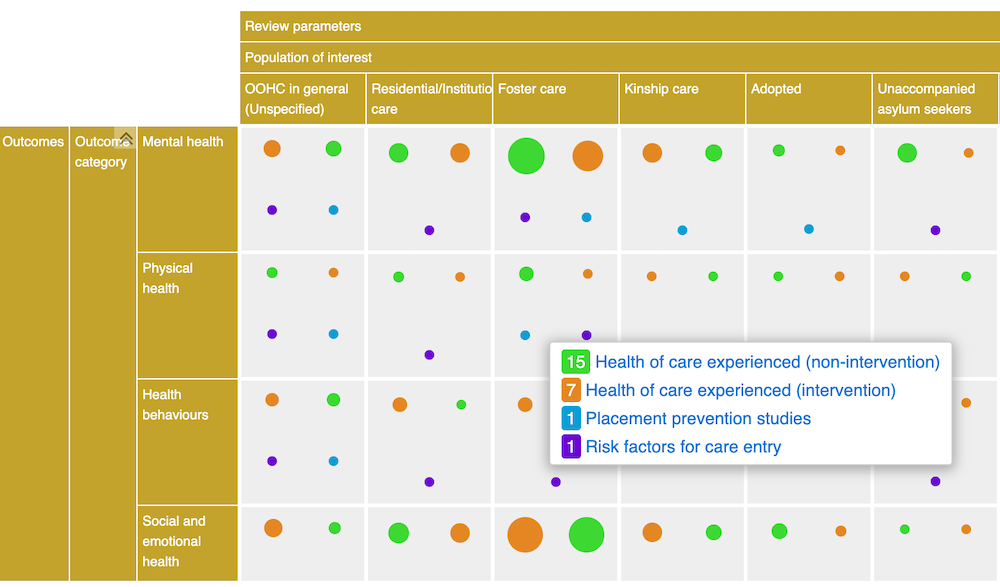
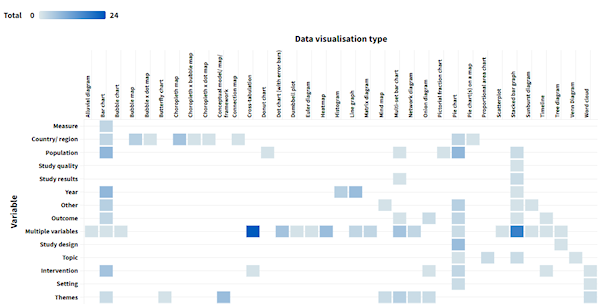
Evidence maps are user-friendly tools that display the breadth, depth and volume of research on a topic. They help visualise evidence landscapes, and can help to identify knowledge gaps and inform interactive decision-making.
We use EPPI Mapper and EPPI-Visualiser to produce evidence maps that help with methodological reviews and inform policy decisions.
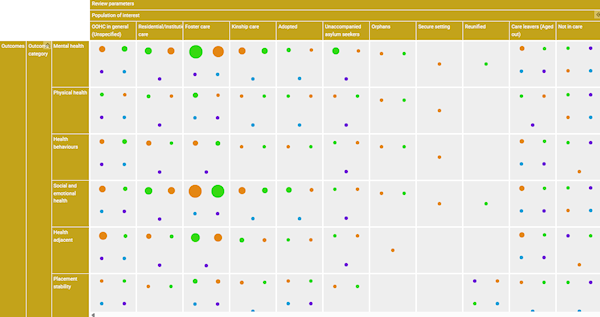
Below you explore some of the evidence maps that we have produced.