
Infographics
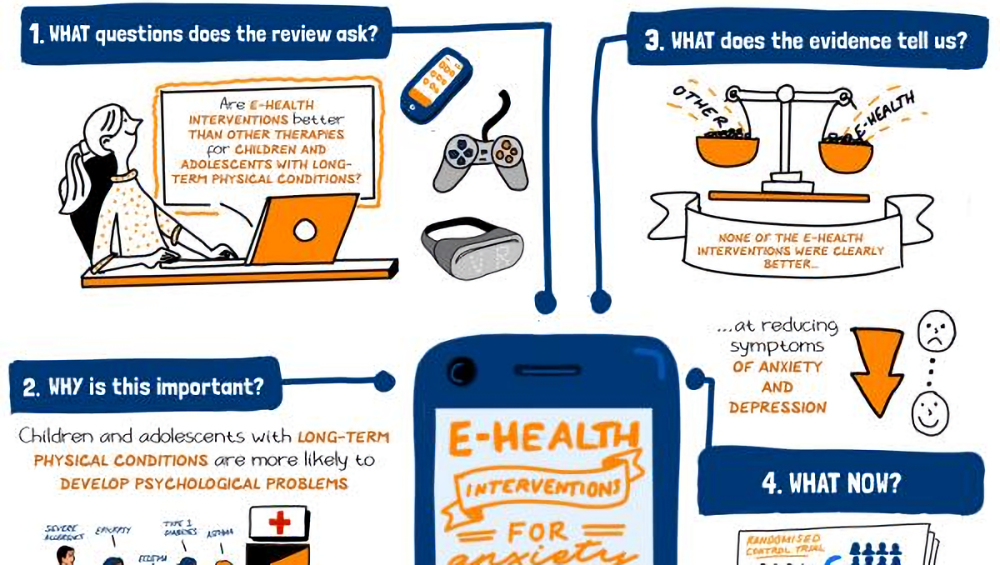
Infographics turn complex research findings into visual summaries that busy, non-specialist audiences can grasp quickly.
Our infographics particularly suit several of our audience groups: practitioners can use them as rapid reference tools; patients, carers and the public benefit from plain-language visual explanations; and policymakers and commissioners can use them to see key messages and implications for practice development.
We share infographics on our social media, in newsletters, at events and in training materials, extending the reach of findings beyond academic publications.
To make them effective, we partner with professional designers, developing infographics with a clear purpose and audience in mind, limiting each to a small number of key messages and using accessible language and visuals. We test drafts with members of the intended audience, including patient and public contributors, to check that they are understandable, relevant and useful.