When is a little more a lot less?
Posted on Monday 16 February 2026

“The last straw” is a weird phenomenon on the face of it. We have an intuition as to when it occurs in real life: usually something is used too much and is quietly worn away before – *snap* – it falls apart. But this is oddly hard to model in a “nice” way. Normally, in mathematics, we want to consider what assumptions lead to certain outcomes. Putting in, say, a step function is an easy way to get this sort of snapping behaviour, but that’s because we explicitly put the behaviour there. There’s no discovery and no new knowledge gained.
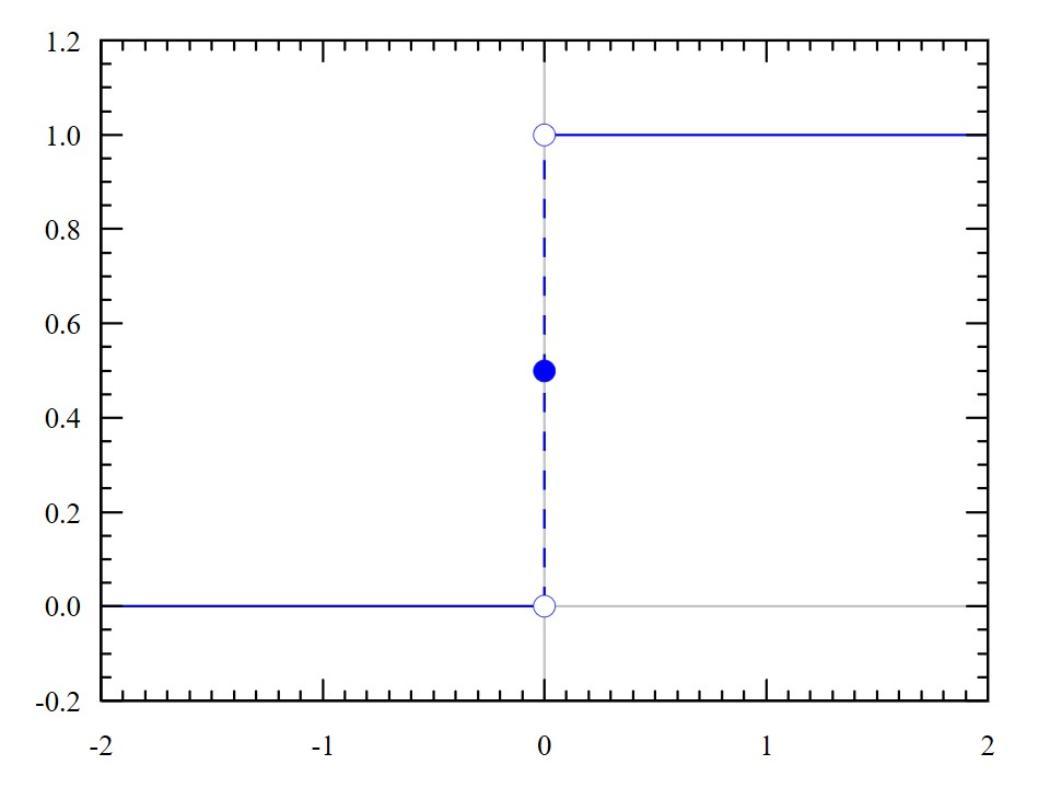 Step functions look like literal steps: taking one value for a time before suddenly taking another value. Dirac distribution CDF by Omegatron. CC BY-SA 3.0.
The usual way to discover it in a model then is to look for tipping points, or similar. In some ways, tipping points are better than the step function; in principle, the step function reverses if you reverse direction at the same point where it snapped originally. This isn’t so for models that “tip”; this last straw matches our intuition better. But the “or similar” is instructive: in mathematics, tipping points are usually thought of as a type of bifurcation, and not only are there multiple types of tipping, but there are multiple types of bifurcation (some of which are catastrophes) and the concept of hysteresis to tackle.
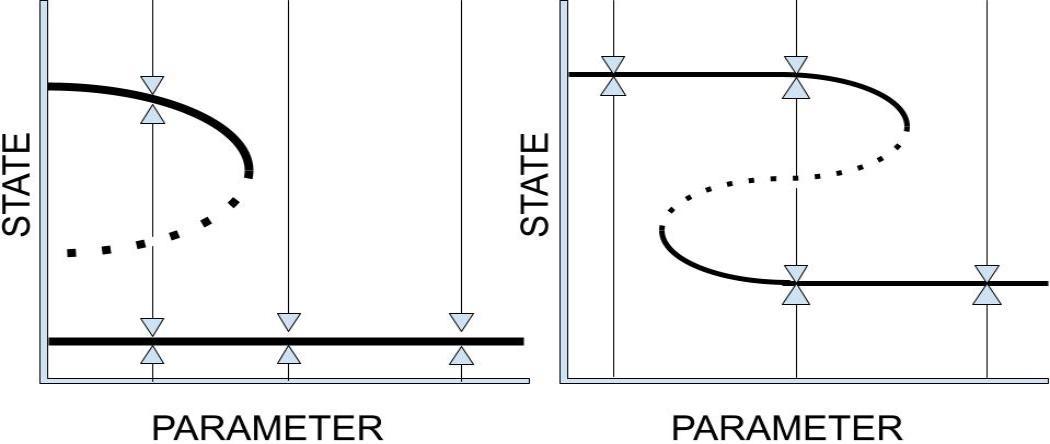 Two common example systems with tipping behaviour. If you were to put a marble on either plot, the marble tends to run along the arrows to the solid black lines and away from the dotted lines. If you move the marble to the right while on the top line, it eventually falls to the bottom line. On the left plot it stays there forever while it can eventually get back to the top line on the right plot by moving the marble far enough to the left.
Rather than dive into equations to give a taster of what these things mean, let’s attack it from the other direction: what is it that we mean by “the last straw”?
- Usually, it involves an accumulation of something and a diminishing capacity to hold that something.
- Going (increasingly) slowly you can fit in a little bit more, but going too quickly “breaks” the system.
- Breaking the system results in a dramatic decline in capacity for whatever it was accumulating.
- The transition from accruing to broken is “fast”.
- “Fixing” the broken system is comparatively “slow”, if not impossible.
These statements are broadly about two different aspects of the system. The first three are about the variables of interest. These state that there is a variable, and it can break if it does too much. If it does break, then it is less able to do what it was doing before. But just because something breaks down doesn’t mean that it is the last straw. A car that you know will only last another hundred miles and starts to throw up alarms before finally puttering to a stop doesn’t feel like the last straw.
This is where the last two come in, which are about how the transition between “fixed” and “broken” occurs, leading to hysteresis or path dependence. Roughly, they capture the idea that how you get to a certain state matters and this is where the drama of the last straw comes in. Mathematically, this is best shown with bifurcation plots, which usually look like they have multiple curves on it. On the y-axis, you have the outcome variable, while on the x-axis, you usually have a parameter that you have some control over. Navigating these plots then is like the tilt-maze games in that you might be moving the parameter back- and forwards to get the outcome to the desired value. When you hit the last straw, you don’t have time to react; the ball is already falling in and if you’re standing on that glacier when it calves, you’re going down with it.
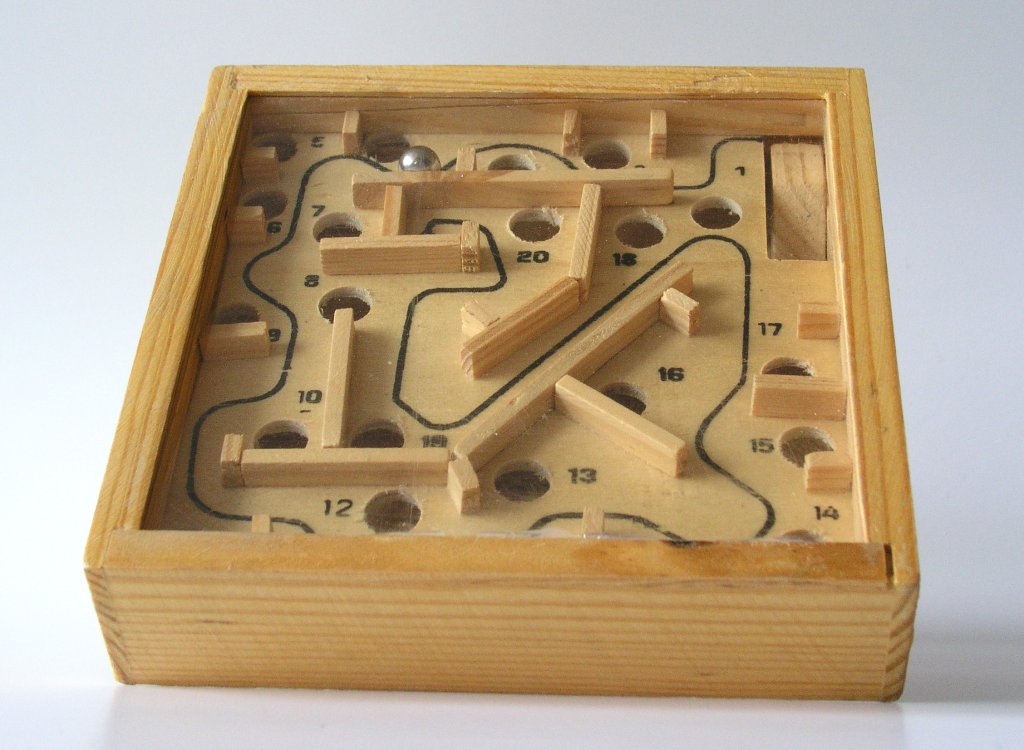 Navigating a complex system with lots of “last straws” such as tipping points is a lot like tilting marble maze games. There are some safe spots to leave the system in temporarily, but there are plenty of places the marble can be lost. PuzzleOfDexterity by Andreas.Roever. CC BY-SA 3.0.
But the description above of the last straw, better matches the description of tipping points in areas like climate science than in areas like mathematics. Indeed, it isn’t uncommon for the way one discipline uses a word to differ greatly from another even when ostensibly referring to the same phenomenon (chaos is another good example related to mathematics). This isn’t a problem in and of itself, but this makes communication between fields more difficult!
This isn’t to say that mathematicians are not interested in studying climate tipping points, but, e.g., the Planetary Boundaries are not exactly what we mean by tipping points (noting, of course, the confusion over what precisely is meant). As such, when studying any last straw we need to ask: which last straw, for whom, and what makes it a last straw? When you see talk of tipping points, boundaries, limits, etc. this bundle of questions is key to actually understanding what a given piece or article is trying to achieve or understand, because the last straw is a phenomenon that is just as much about perception as it is about modelling and understanding.