Details in decline(s)?
Posted on Tuesday 29 March 2022
The science of ecology strives to understand and identify general rules governing the abundance and distribution of species. Conservation biology focuses on protecting biodiversity and identifying species declines. Combine these with the ubiquity of metrics in modern society and what do we get? A multitude of biodiversity trends and metrics.
Complex patterns
One major aim is to produce general trends or indicators to track the state of biodiversity. A prime example is the Living Planet Index which is seen as a measure of the state of the world’s biodiversity and generates much media attention. But what do we really know about the state of the world’s biodiversity? Well, we know that many species are declining, some have become extinct (likely some which were never catalogued, and the extinction rate is thought to be high compared to the background rate). Other species are increasing, and some are even benefiting from the changes humanity has wrought. Beyond this it becomes more complicated.
Even seemingly uncontroversial statements such as these reveal more and more complexities the closer you look – decreasing where? Increasing relative to when? Any measures of global biodiversity change face a number of hard to overcome limitations. These are often clearly outlined but not necessarily widely understood. Firstly, even efforts based on phenomenal amounts of data such as the Living Planet Index only cover a small proportion of populations representing only a fraction of global species. So, we only have data on a small proportion of the world’s species and for most species only a limited number of their populations are monitored across part of their geographic distribution.
Why does this matter? Well, different species and species groups can respond very differently to environmental change and data on well-studied groups may not provide a good proxy for others. Even different populations of the same species can respond in different ways to environmental change. Given that we do not have representative trends for everything, how do we combine the information we do have to get an overall picture upon which to base advice for policy makers?
Representative metrics
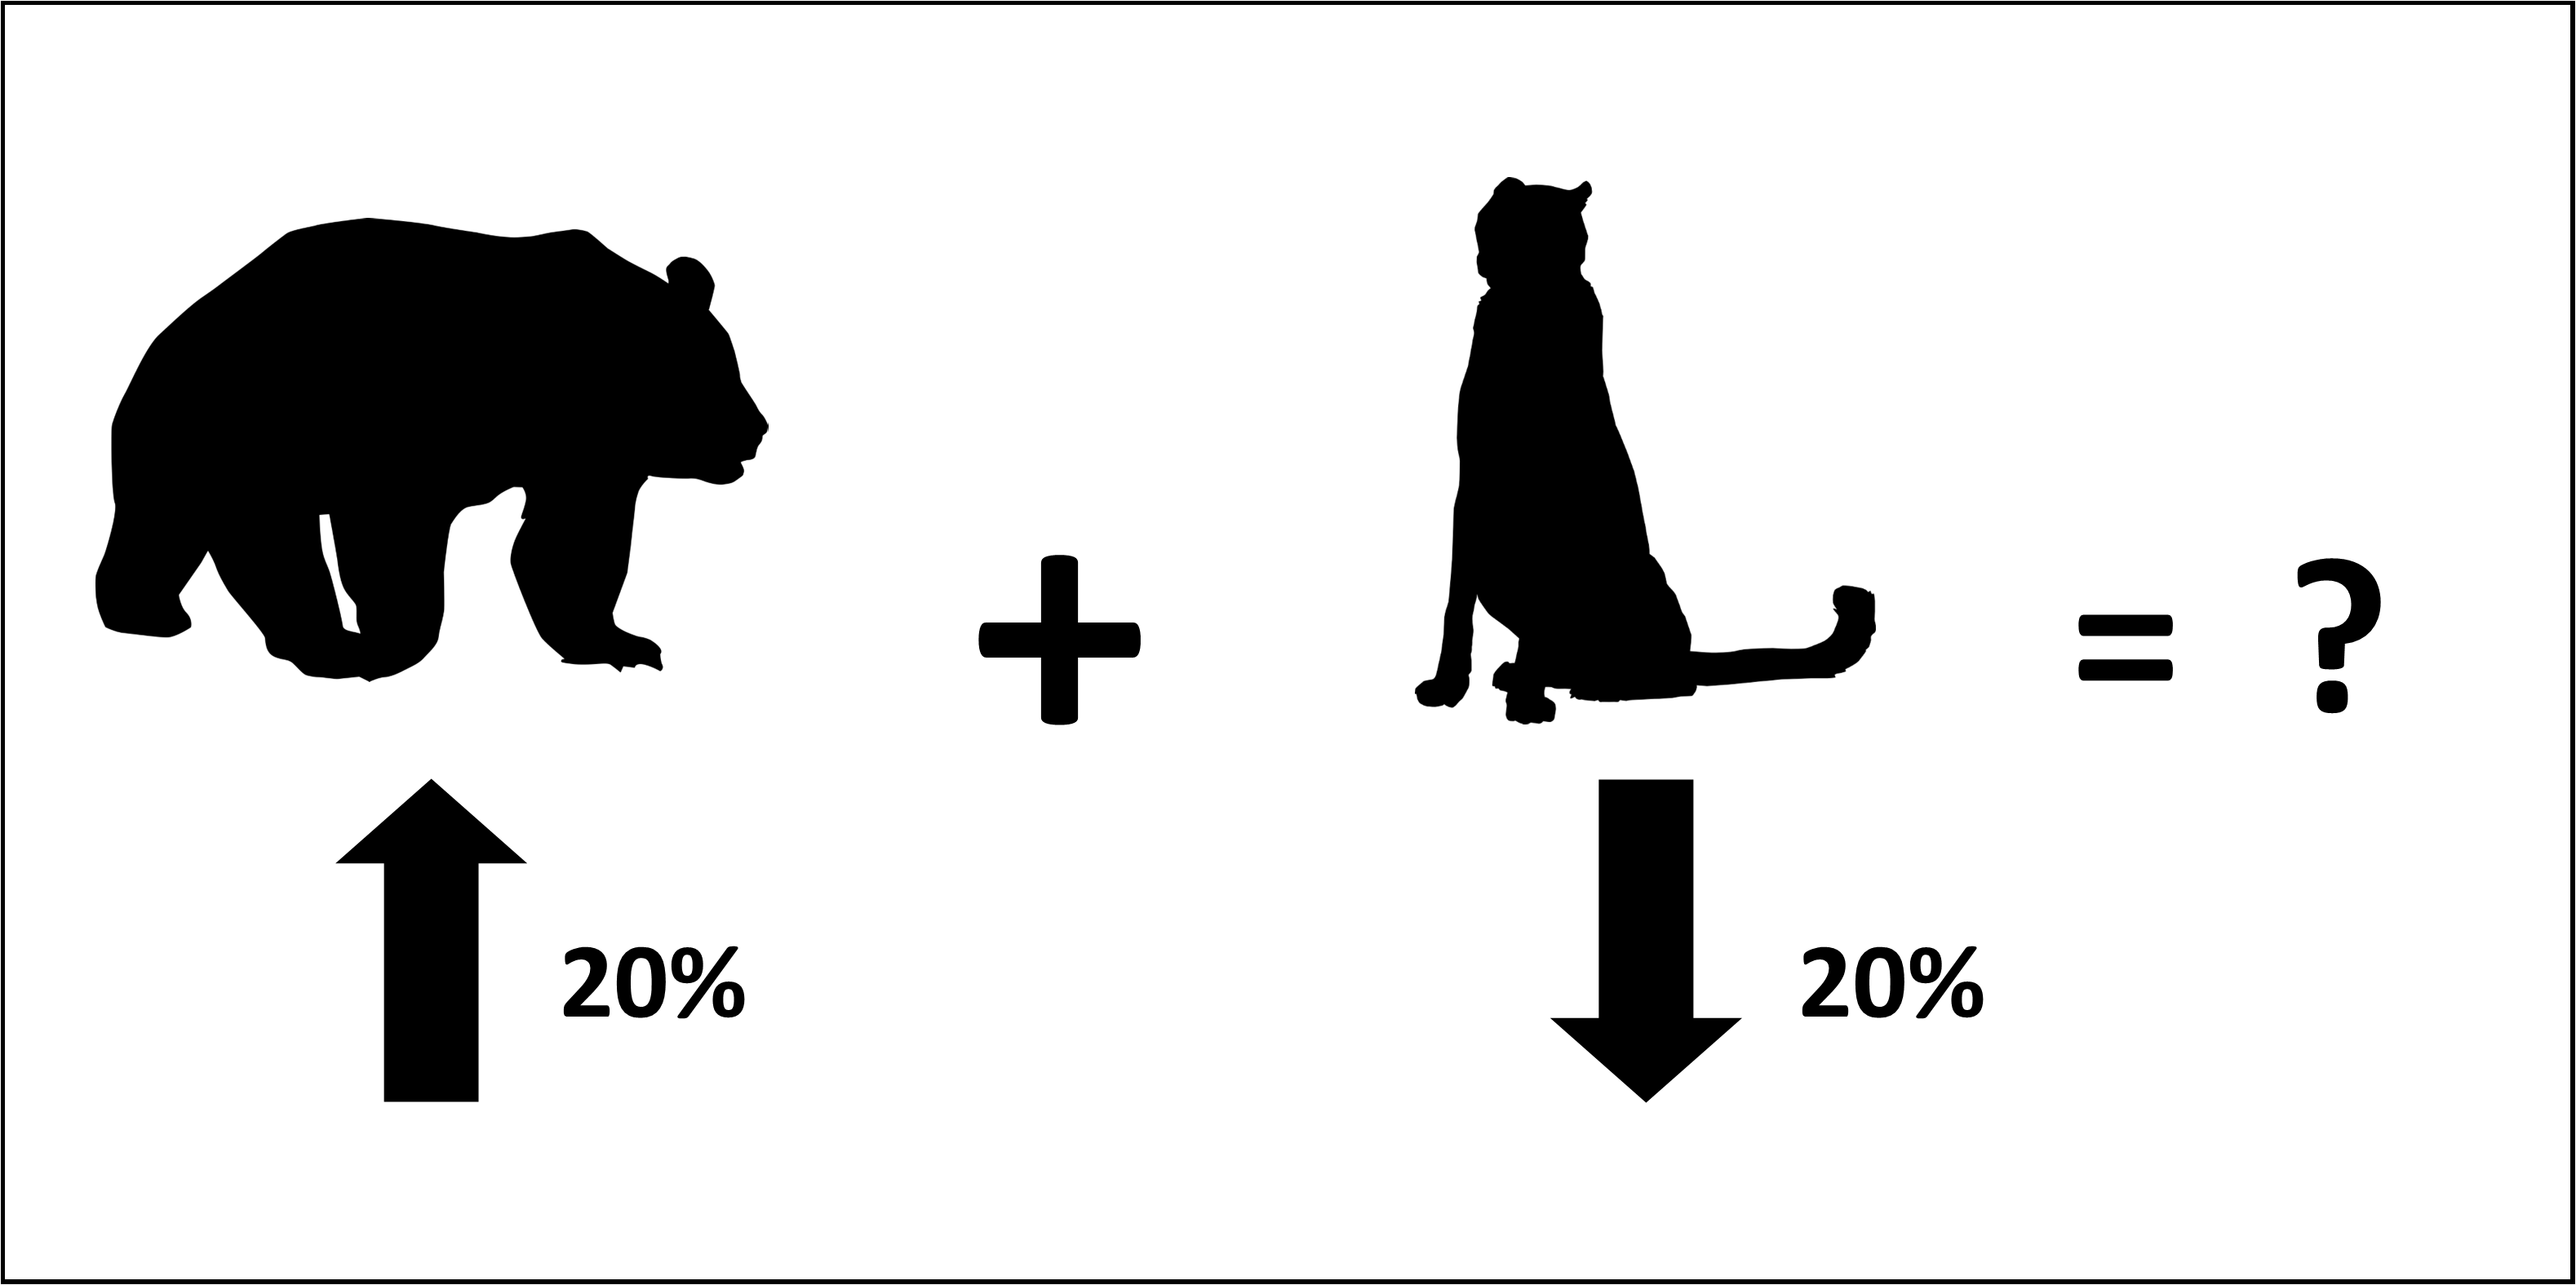
From its inception, conservation science has been an explicitly values driven endeavour, but it is very easy to lose sight of just how subtle the effects of our values can be when we’re striving to produce objective scientific claims. When we use quantitative metrics to prescribe conservation actions, value judgments and trade-offs face us at every turn. For instance, is a 20% decline in cheetahs offset by a 20% increase in giant pandas? Moreover, what is the value of either of these when compared with the comfort and nutrition of a human population competing for space? Values aside, how do we even get a representative measure for a single species - given that we can’t monitor all populations. What generalities can be drawn from a 20% decline in one cheetah population? Is this representative of all cheetah populations everywhere with cheetahs never prospering? When trying to get an overall answer for biodiversity it isn’t really a game of more or less, higher or lower. It is hard to conclude if there is more biodiversity or less biodiversity when plagued by the complexities of scales (both space and time) and the huge variety of life on Earth. This is because the answer is often that you now have different biodiversity - it’s quite literally like comparing apples and oranges.
So, what to do? Although the expansion of citizen science and biological recording as well as new technological assets such as remote sensing and camera traps are vastly increasing monitoring capacity, global randomised monitoring across a vast array of species is still far away meaning we must do the best with what we have. Perhaps we would get a more representative view if we only look at population trends from areas in which the populations of all species present in the community are monitored? It certainly helps to obtain complimentary assessments such as these, but questions of bias continue to pop up like whack-a-mole. Now the focus shifts to why a particular area was chosen for community-level monitoring. If the majority of data is collected from protected sites for example or sites under major threats from drivers of change, this will greatly influence the result, perhaps multiplying the bias across the focal community.
As we strive to use ever bigger datasets to assess global trends, we must tread the tightrope of generalisability versus nuance carefully. We need not only to try and fill in the representativeness gaps in current collated datasets but to also aim to understand these gaps and their influence on our interpretations. For example, most datasets have clear geographic biases towards the same regions where more data collection is conducted. Understanding the limits of our knowledge is important knowledge in itself. The amplification of these data limits by the caveats of the methods used for assessment must also continue to be elucidated. For example, the influence of the extreme population trends of a few species on the overall average.
In practice
Are these issues, however, a great impediment to conservation in the short term? In many cases, perhaps they are not major ones. The main drivers of biodiversity change such as land use and climate change are well known. Moreover, much of effective conservation works by embracing complexities, digging deep into population specific requirements and providing tailor-made solutions to bolster specific populations. However, species assemblages are dynamic and continued change is inevitable, raising the clear challenge that past management strategies may no longer deliver the same results in a changing world. To really address biodiversity change we must combat these large scale drivers directly rather than the species changes which are simply their symptoms. This will at times require us to look deeper than the quantitative metrics we use to measure biodiversity change, down to the bedrock of values underlying claims and advice made from such metrics. The devil is in the details.