NHS adopts Centre for Health Economics Clinical Commissioning Group health inequality indicators
Posted on Tuesday 16 August 2016

The indicators are designed to help local NHS managers reduce potentially avoidable A&E admissions arising from social inequality, and were developed by researchers at the Centre for Health Economics.
The indicators focus on emergency hospitalisation for patients with long-term conditions such as dementia, diabetes, respiratory and cardiovascular diseases, which previous research has shown can be reduced by more effective primary care and outpatient care.
The indicators have just been rolled out as part of the NHS Clinical Commissioning Group Improvement and Assessment Framework. They show large differences in inequality performance between different clinical commissioning groups across the country, and that between April 2015 and April 2016 there were 264,000 of these excess hospitalisations associated with socioeconomic inequality.
| Rank | Worst 10 CCGs | Indicator value* | Rank | Best 10 CCGs | Indicator value* | |
|---|---|---|---|---|---|---|
| 1 | Central Manchester | 2136 | 1 | City and Hackney | -76 | |
| 2 | Blackburn and Darwen | 2029 | 2 | Fareham and Gosport | 109 | |
| 3 | North Manchester | 2017 | 3 | East Surrey | 110 | |
| 4 | Islington | 1954 | 4 | Crawley | 132 | |
| 5 | South Manchester | 1889 | 5 | Isle of Wight | 138 | |
| 6 | East Lancashire | 1631 | 6 | South Eastern Hampshire | 139 | |
| 7 | North Lincolnshire | 1544 | 7 | Tower Hamlets | 237 | |
| 8 | Liverpool | 1523 | 8 | Portsmouth | 310 | |
| 9 | Hartlepool and Stockton-on-tees | 1499 | 9 | Wyre Forest | 341 | |
| 10 | Stockport | 1497 | 10 | Shropshire | 354 |
* difference in rate of hospitalisations between richest and poorest areas per 100,000 of population, national average level of inequality in these reducible hospitalisations 927 per 100,000 population, all listed CCGs are statistically significantly different to both the national average level of the indicator and the average level of the indicator for the group of 10 CCGs most similar to them
The results show that this variation occurs regardless of the deprivation of the area for example Liverpool CCG which appears on the worst performers list and Tower Hamlets CCG and Portsmouth CCG which appear on the best performers list each serve some of the most deprived neighbourhoods in the country. Similarly for more affluent areas of the country South Cheshire performs badly on inequalities with an indicator value of 1316 excess hospitalisations per 100,000 population whilst East Surrey CCG performs well appearing in the top ten list.
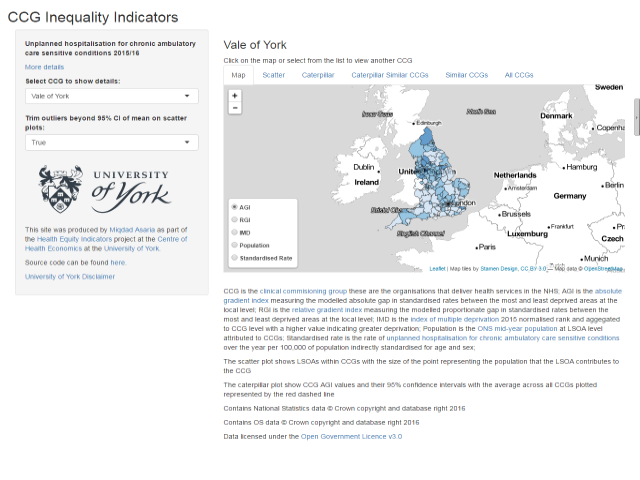
Researchers at the University of York have developed an online tool to allow members of the public to explore inequalities within their CCGs for themselves available at: http://www.ccg-inequalities.co.uk/
NHS policymakers and managers have a legal duty to consider reducing inequalities. However, reliable information on healthcare inequalities is currently scarce: national monitoring focuses on the average patient, and little attention is given to local monitoring of healthcare inequality. These indicators could be used to help managers learn quality improvement lessons, to help regulators and others hold the NHS to account, and to help inform the public about healthcare inequalities within their local area.
Lead investigator, Professor Richard Cookson
Social inequalities in potentially avoidable emergency hospitalisation impose large and rising costs on the NHS, as well as raising important concerns about social justice. For the first time, NHS managers can now find out how well their local CCG area is doing in tackling these inequalities, compared with similar CCG areas, and see how these inequalities are responding to local healthcare initiatives. This will help NHS managers learn about the best ways of reducing costly health emergencies associated with social deprivation.
Ruth Passman, Head of Equality and Heath Inequalities at NHS England.
Articles appeared in the Guardian and the Independent on Saturday 20th August 2016.
Funding declaration:
- This study is Independent research funded by the National Institute for Health Research via the Health Services Research and Delivery Programme (HS&DR - 11/2004/39) and Dr Richard Cookson's Senior Research Fellowship (SRF-2013-06-015). The funding body did not play any role in the study design; in the collection, analysis, and interpretation of data; in the writing of the report; and in the decision to submit the article for publication. The views expressed in this publication are those of the author(s) and not necessarily those of the NHS, the National Institute for Health Research or the Department of Health.
- The National Institute for Health Research (NIHR) is funded by the Department of Health to improve the health and wealth of the nation through research. The NIHR is the research arm of the NHS. Since its establishment in April 2006, the NIHR has transformed research in the NHS. It has increased the volume of applied health research for the benefit of patients and the public, driven faster translation of basic science discoveries into tangible benefits for patients and the economy, and developed and supported the people who conduct and contribute to applied health research. The NIHR plays a key role in the Government’s strategy for economic growth, attracting investment by the life-sciences industries through its world class infrastructure for health research. Together, the NIHR people, programmes, centres of excellence and systems represent the most integrated health research system in the world. For further information, visit the NIHR website (www.nihr.ac.uk).
The research underpinning the new indicator can be found in the following research report: Cookson, R., Asaria, M, Ali, S, Ferguson, B, Fleetcroft, R, Goddard, M, Goldblatt, P, Laudicella, M, Raine, R. 2016.Health Equity Indicators for the English NHS: Longitudinal whole-population study at small area level. NIHR Health Services and Delivery Research Programme Project Number 11/2004/39 http://www.nets.nihr.ac.uk/projects/hsdr/11200439
Further information is available here: https://www.york.ac.uk/che/research/equity/monitoring/
The NHS Indicator can be found at: http://www.nhs.uk/Scorecard/Pages/IndicatorFacts.aspx?MetricId=463