KITE Resources
AFRICLIM 3.0
AFRICLIM provides high-resolution ensemble climate projections for Africa. The spatial database includes monthly grids of temperature and rainfall, and derived bioclimatic summary variables such as moisture indices and dry season length.
Version 3.0 of the database spans ten general circulation models (GCMs), downscaled using five regional climate models (RCMs) and four contemporary baselines, under two representative concentration pathways of the IPCC-AR5 (RCP4.5 and RCP8.5). Methods are otherwise as described in Platts et al. (2015).
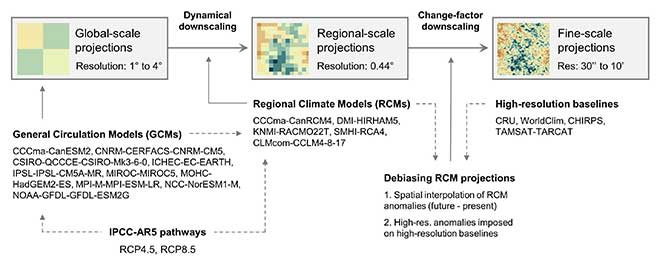
RCM outputs are bias-corrected and change-factor downscaled using four high-resolution baseline climatologies: CRU CL 2.0 (1961-1990), WorldClim v1.4 (1950-2000), TAMSAT TARCAT v2.0 (1983-2012) and CHIRPS v1.8 (1983-2012). CRU and WorldClim are interpolated from station data, whereas TAMSAT and CHIRPS combine rain gauge data with satellite observations to improve accuracy where in situ rainfall measurements are sparse.
Monthly means, summary variables and multimodel ensembles are provided for the middle (2041-2070) and late (2071-2100) 21st century at a range of high-spatial resolutions: 10' (18.6 km at the equator), 5' (9.3 km), 2.5' (4.6 km), 1' (1.9 km) and 30" (928 m), with the highest resolution determined by the baseline climatology. TAMSAT and CHIRPS were resampled (bilinear) to 2.5' from native resolutions of 2.25' and 3' respectively.
Data download
The archives linked below contain sets of GeoTIFFs. The maps use a geographic coordinate system (WGS1984) which is embedded in the files. To explore the maps, you will need a GIS program such as QGIS or the R raster package.
The following variables are available: monthly precipitation (pr); monthly 2-metre air temperature (tas); monthly averages of daily minimum (tasmin) and daily maximum (tasmax) air temperatures; annual and seasonal summary variables relating to temperature (tbio) and moisture (mbio).
See the README for variable definitions, nomenclature and units.
|
Baseline climatology | Baseline year [mean over] | Spatial resolution |
|---|---|---|
| CRU CL 2.0 | 1975 [1961-1990] | 10' - - - - |
| WorldClim v1.4 | 1975 [1950-2000] | 10' 5' 2.5' 1' 30" |
| TAMSAT TARCAT v2.0 (rainfall only) | 2000 [1983-2012] | 10' 5' 2.5' - - |
| CHIRPS v1.8 (rainfall only) | 2000 [1983-2012] | 10' 5' 2.5' - - |
| AFRICLIM-ENSEMBLES 3.0 | Baseline | Emissions pathway | Future year [mean over] | Spatial resolution |
|---|---|---|---|---|
|
Summary statistics (mean, min, max) Regional models: CCCma-CanRCM4_r2, Driving GCMs: CCCma-CanESM2, |
CRU | RCP4.5 | 2055 [2041-2070] 2085 [2071-2000] |
10' - - - - 10' - - - - |
| RCP8.5 | 2055 [2041-2070] 2085 [2071-2000] |
10' - - - - 10' - - - - |
||
| WorldClim | RCP4.5 | 2055 [2041-2070] 2085 [2071-2000] |
10' 5' 2.5' 1' 30"† 10' 5' 2.5' 1' 30"† |
|
| RCP8.5 | 2055 [2041-2070] 2085 [2071-2000] |
10' 5' 2.5' 1' 30"† 10' 5' 2.5' 1' 30"† |
||
| TAMSAT |
RCP4.5 | 2055 [2041-2070] 2085 [2071-2000] |
10' 5' 2.5' - - 10' 5' 2.5' - - |
|
| RCP8.5 | 2055 [2041-2070] 2085 [2071-2000] |
10' 5' 2.5' - - 10' 5' 2.5' - - |
||
| CHIRPS |
RCP4.5 | 2055 [2041-2070] 2085 [2071-2000] |
10' 5' 2.5' - - 10' 5' 2.5' - - |
|
| RCP8.5 | 2055 [2041-2070] 2085 [2071-2000] |
10' 5' 2.5' - - 10' 5' 2.5' - - |
| Individual model results | Baseline | Emissions pathway | Future year [mean over] | Spatial resolution |
|---|---|---|---|---|
|
Swedish Meteorological and Regional model: SMHI-RCA4_v1 Driving GCMs: CCCma-CanESM2, |
CRU | RCP4.5 | 2055 [2041-2070] 2085 [2071-2000] |
10' - - - - 10' - - - - |
| RCP8.5 | 2055 [2041-2070] 2085 [2071-2000] |
10' - - - - 10' - - - - |
||
| WorldClim | RCP4.5 | 2055 [2041-2070] 2085 [2071-2000] |
10' 5' 2.5' 1' 30" 10' 5' 2.5' 1' 30" |
|
| RCP8.5 | 2055 [2041-2070] 2085 [2071-2000] |
10' 5' 2.5' 1' 30" 10' 5' 2.5' 1' 30" |
||
| TAMSAT |
RCP4.5 | 2055 [2041-2070] 2085 [2071-2000] |
10' 5' 2.5' - - 10' 5' 2.5' - - |
|
| RCP8.5 | 2055 [2041-2070] 2085 [2071-2000] |
10' 5' 2.5' - - 10' 5' 2.5' - - |
||
| CHIRPS |
RCP4.5 | 2055 [2041-2070] 2085 [2071-2000] |
10' 5' 2.5' - - 10' 5' 2.5' - - |
|
| RCP8.5 | 2055 [2041-2070] 2085 [2071-2000] |
10' 5' 2.5' - - 10' 5' 2.5' - - |
||
|
Canadian Centre for Climate Regional model: CCCma-CanRCM4_r2 Driving GCM: CCCma-CanESM2
|
CRU | RCP4.5 | 2055 [2041-2070] 2085 [2071-2000] |
10' - - - - 10' - - - - |
| RCP8.5 | 2055 [2041-2070] 2085 [2071-2000] |
10' - - - - 10' - - - - |
||
| WorldClim | RCP4.5 | 2055 [2041-2070] 2085 [2071-2000] |
10' 5' 2.5' 1' 30" 10' 5' 2.5' 1' 30" |
|
| RCP8.5 | 2055 [2041-2070] 2085 [2071-2000] |
10' 5' 2.5' 1' 30" 10' 5' 2.5' 1' 30" |
||
| TAMSAT |
RCP4.5 | 2055 [2041-2070] 2085 [2071-2000] |
10' 5' 2.5' - - 10' 5' 2.5' - - |
|
| RCP8.5 | 2055 [2041-2070] 2085 [2071-2000] |
10' 5' 2.5' - - 10' 5' 2.5' - - |
||
| CHIRPS |
RCP4.5 | 2055 [2041-2070] 2085 [2071-2000] |
10' 5' 2.5' - - 10' 5' 2.5' - - |
|
| RCP8.5 | 2055 [2041-2070] 2085 [2071-2000] |
10' 5' 2.5' - - 10' 5' 2.5' - - |
||
|
Danish Meteorological Regional model: DMI-HIRHAM5_v2 Driving GCM: ICHEC-EC-EARTH |
CRU | RCP4.5 | 2055 [2041-2070] 2085 [2071-2000] |
10' - - - - 10' - - - - |
| RCP8.5 | 2055 [2041-2070] 2085 [2071-2000] |
10' - - - - 10' - - - - |
||
| WorldClim | RCP4.5 | 2055 [2041-2070] 2085 [2071-2000] |
10' 5' 2.5' 1' 30" 10' 5' 2.5' 1' 30" |
|
| RCP8.5 | 2055 [2041-2070] 2085 [2071-2000] |
10' 5' 2.5' 1' 30" 10' 5' 2.5' 1' 30" |
||
| TAMSAT |
RCP4.5 | 2055 [2041-2070] 2085 [2071-2000] |
10' 5' 2.5' - - 10' 5' 2.5' - - |
|
| RCP8.5 | 2055 [2041-2070] 2085 [2071-2000] |
10' 5' 2.5' - - 10' 5' 2.5' - - |
||
| CHIRPS |
RCP4.5 | 2055 [2041-2070] 2085 [2071-2000] |
10' 5' 2.5' - - 10' 5' 2.5' - - |
|
| RCP8.5 | 2055 [2041-2070] 2085 [2071-2000] |
10' 5' 2.5' - - 10' 5' 2.5' - - |
||
|
Royal Netherlands Meteorological Regional model: KNMI-RACMO22T_v1 Driving GCMs: ICHEC-EC-EARTH, |
CRU | RCP4.5 | 2055 [2041-2070] 2085 [2071-2000] |
10' - - - - 10' - - - - |
| RCP8.5 | 2055 [2041-2070] 2085 [2071-2000] |
10' - - - - 10' - - - - |
||
| WorldClim | RCP4.5 | 2055 [2041-2070] 2085 [2071-2000] |
10' 5' 2.5' 1' 30" 10' 5' 2.5' 1' 30" |
|
| RCP8.5 | 2055 [2041-2070] 2085 [2071-2000] |
10' 5' 2.5' 1' 30" 10' 5' 2.5' 1' 30" |
||
| TAMSAT |
RCP4.5 | 2055 [2041-2070] 2085 [2071-2000] |
10' 5' 2.5' - - 10' 5' 2.5' - - |
|
| RCP8.5 | 2055 [2041-2070] 2085 [2071-2000] |
10' 5' 2.5' - - 10' 5' 2.5' - - |
||
| CHIRPS |
RCP4.5 | 2055 [2041-2070] 2085 [2071-2000] |
10' 5' 2.5' - - 10' 5' 2.5' - - |
|
| RCP8.5 | 2055 [2041-2070] 2085 [2071-2000] |
10' 5' 2.5' - - 10' 5' 2.5' - - |
||
|
Climate Limited-area Regional model: CLMcom-CCLM4-8-17_v1 Driving GCMs: CNRM-CERFACS-CNRM-CM5, |
CRU | RCP4.5 | 2055 [2041-2070] 2085 [2071-2000] |
10' - - - - 10' - - - - |
| RCP8.5 | 2055 [2041-2070] 2085 [2071-2000] |
10' - - - - 10' - - - - |
||
| WorldClim | RCP4.5 | 2055 [2041-2070] 2085 [2071-2000] |
10' 5' 2.5' 1' 30" 10' 5' 2.5' 1' 30" |
|
| RCP8.5 | 2055 [2041-2070] 2085 [2071-2000] |
10' 5' 2.5' 1' 30" 10' 5' 2.5' 1' 30" |
||
| TAMSAT |
RCP4.5 | 2055 [2041-2070] 2085 [2071-2000] |
10' 5' 2.5' - - 10' 5' 2.5' - - |
|
| RCP8.5 | 2055 [2041-2070] 2085 [2071-2000] |
10' 5' 2.5' - - 10' 5' 2.5' - - |
||
| CHIRPS |
RCP4.5 | 2055 [2041-2070] 2085 [2071-2000] |
10' 5' 2.5' - - 10' 5' 2.5' - - |
|
| RCP8.5 | 2055 [2041-2070] 2085 [2071-2000] |
10' 5' 2.5' - - 10' 5' 2.5' - - |
Platts PJ, Omeny PA, Marchant R (2015). AFRICLIM: high-resolution climate projections for ecological applications in Africa. African Journal of Ecology 53, 103-108 [PDF]
Platts PJ, Omeny PA, Marchant R (2015). AFRICLIM 3.0: high-resolution ensemble climate projections for Africa. figshare, doi:10.6084/m9.figshare.1284624
Funded by Ministry for Foreign Affairs of Finland through the CHIESA project. RCM outputs were made available by various regional centres through the CORDEX initiative. Regional projections were further downscaled using data from the Climatic Research Unit (University of East Anglia), WorldClim (University of California / CIAT), TAMSAT Research Group (University of Reading) and the Climate Hazards Group (University of California / USGS).
Leaf Area Indices
Vegetation canopies are fundamental to ecosystem function, regulating carbon, water and nutrient cycles. A common descriptor of canopy structure is the Leaf Area Index (LAI), defined as half the total leaf surface area per ground surface area.
Across East Africa, we measure LAI and FAPAR (fraction of absorbed photosynthetically active radiation), both Essential Climate Variables. Targeting a wide range of habitats, we gain an understanding of how canopy structure varies with environmental traits and human disturbance across space and time.
Through a wider collaborative network (The Global LAI Project) we are currently working to expand the dataset across the tropics.
In the field
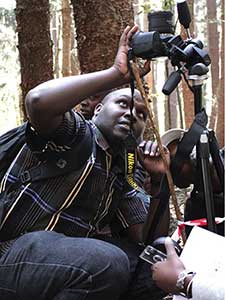
Time is the dominant constraint when determining LAI in the field. Harvesting approaches yield the most accurate results, but are very site-specific and impractical to implement over large areas. Indirect approaches now enable more rapid assessments of LAI - for a review of techniques, see Bréda (2003) and Jonckheere et al. (2004).
KITE uses two indirect methods: the Sunscan Delta-T instrument and hemispherical photography. The SunScan analysis system estimates LAI based on measurements of incident and transmitted photosynthetically active radiation in vegetation canopies. Hemispherical images of canopy structure are obtained using a digital camera plus ‘fisheye’ lens and tripod. Sampling protocol follows either a modified VALERI procedure, or alternatively LAI is measured along linear north-south transects through a particular biome. For more information, see this manual.
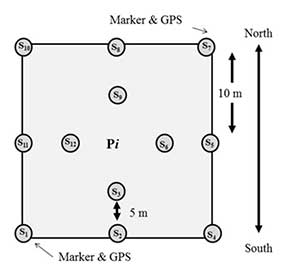
Sampling strategy for monitoring plots within different biomes. Hemispherical images (one per sampling point, S1 to S12) and SunScan readings (three per sampling point) are taken in 20m x 20m plots, following a ‘VALERI’ design to capture sub-pixel vegetation heterogeneity in canopy structure
Back in the lab
SunScan LAI readings are averaged within each plot, yielding a final estimate of LAI. Estimation of LAI from hemispherical images (more accurately Plant Area Index) requires a little more work. First, the images are pre-processed, extracting the blue band information and then applying a thresholding algorithm to achieve maximum contrast between leaf and sky. These dichotomised images can then be used to estimate gap fraction, LAI and FAPAR per plot. For further details on these techniques, see Pfeifer et al. (2012a).
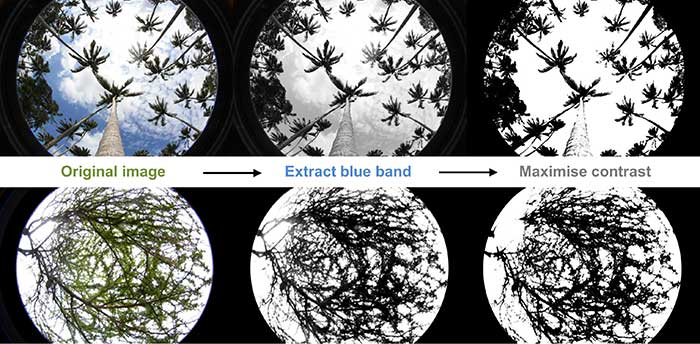
Extracting LAI from hemispherical images. Equipment: 14.2 Megapixels Nikon D3100 Digital SLR camera body equipped with SIGMA 4.5mm f/2.8 Circular Fisheye
In secondary analyses, we are using Spectral Vegetation Indices (VI), which correlate with LAI and productivity, to upscale plot-based measurements to landscape scales, generating regional LAI maps. VIs are formed by arithmetic combinations of two or more spectral bands of optical sensor data (e.g., KOMPSAT, SPOT, Landsat), exploiting the spectral contrast between bands - typically visible red and near-infrared - to relate canopy physical traits to reflectance.
Links between VIs and ecological traits are region-specific, which can introduce aggregation errors when upscaling from plot-level data to moderate/coarse resolution satellite data. A range of earth observation products for LAI and ecosystem productivity exist (reviewed in Pfeifer et al. 2012b). At KITE, we validate the accuracy of these maps using our data.
Because the LAI database spans a range of natural and human-modified biomes along environmental gradients (e.g., temperature, rainfall, elevation, slope, human and animal disturbance), we are also able to test for significant relationships between environmental drivers and canopy structure, as well as biome-specific and environment-independent relationships between hemi and sunscan readings.
Publications
Pfeifer M, Gonsamo A, Woodgate W, Cayuela L, Marshall AR, Ledo A, Paine TCE, Marchant R, Burt A, Calders K, Courtney-Mustaphi C, Cuni-Sanchez A, Deere NJ, Denu D, Gonzalez de Tanago J, Hayward R, Lau A, Macía MJ, Olivier PI, Pellikka P, Seki H, Shirima D, Trevithick R, Wedeux B, Wheeler C, Munishi PKT, Martin T, Mustari A, Platts PJ (2018). Tropical forest canopies and their relationships with climate and disturbance: results from a global dataset of consistent field-based measurements. Forest Ecosystems 5, 8
Pfeifer M, Lefebvre V, Gonsamo A, Pellikka PKE, Marchant R, Denu D, Platts PJ (2014). Validating and linking the GIMMS leaf area index (LAI3g) with environmental controls in tropical Africa. Remote Sensing 6, 1973-1990
Platts PJ, Marchant R, Pfeifer M (2013). Spatial variability of biophysical vegetation traits in East Africa, measured from space and on the ground. Poster presented at the British Ecological Society's Global Change and Biosphere Interactions conference in York [BES LAI Poster (PDF ![]() , 1,915kb)]
, 1,915kb)]
Pfeifer M, Gonsamo A, Disney M, Pellikka P, Marchant R (2012). Leaf area index for biomes of the Eastern Arc Mountains: Landsat and SPOT observations along precipitation and altitude gradients. Remote Sensing of Environment 118, 103-115
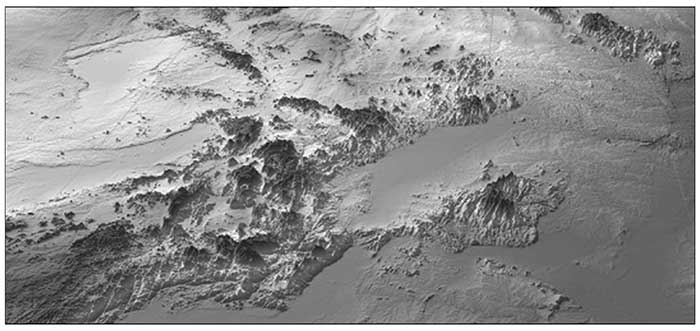
Eastern Arc Mountains
The Eastern Arc Mountains (EAM) consist of 13 disjunct ranges (blocs), stretching from the Taita Hills in south-east Kenya to the Udzungwa Mountains in south-central Tanzania.
Since the 1980s, the EAM have been recognised as biologically distinct from surrounding Afromontane habitats. Exceptional concentrations of rare species are explained by long-term consistency of rain-bearing winds from the Indian Ocean, in combination with long-term isolation of the mountains; the substrate is Precambrian crystalline basement rock, uplifted from the African plateau during the Miocene c. 30 MY ago.
While a qualitative definition has been widely applied (sensu Lovett 1990), precise spatial limits for the area of endemism have been lacking. Thus, fundamental biogeographical questions such as “what is the area of the EAM?” and “how many (endemic) species occur there?” have been troublesome to address with consistency.
Ecoregion definition
In collaboration with Valuing the Arc, the TAITA project and Tropicos, we provide a spatial platform upon which to assemble, analyse and disseminate geographic information for the EAM. The delineation considers elevation, slope angle, terrain roughness and summit prominence relative to base heights (Platts et al. 2011). The boundaries maximise inclusion of preclearance and present-day forest extent, and known distributions of rare mountain flora within a minimal mountain area. Download GIS files here
Accordingly, the EAM cover 5.2 million ha and have an elevational range of 121 m to 2626 m above sea level. Less than 10% of the mountain area is forest - around a third of the preclearance extent. Three quarters of the forest area is under some form of protection: half designated for catchment protection or multi-resource use (Forest Reserves) and the remainder gazetted for nature conservation (Nature Reserves and a National Park). Smaller areas are under participatory management schemes, whereby local communities are jointly (JFM) or solely (CBFM) responsible for managing natural forests for sustainable use and conservation.
Population density is higher than the national average for Tanzania, with 2.3 million people living in the mountains in 2002. The most densely populated mountains are in West Usambara and North Pare, followed by East Usambara and Uluguru. Three of these blocs are also among the most important for species richness and endemism (cf. Burgess et al. 2007, Rovero et al. 2014).
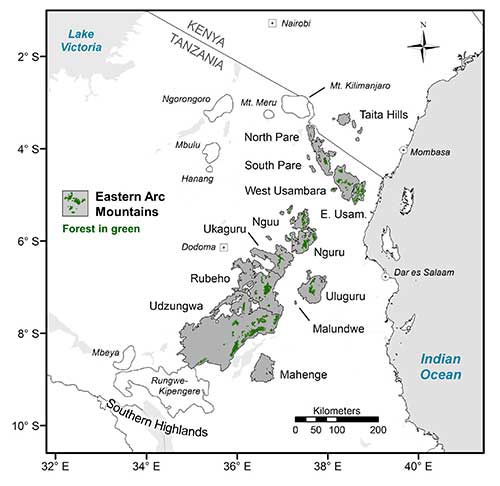
Annual rainfall in the EAM is typically in the range 500-2000 mm, but in some blocs exceeds 3000 mm. Windward eastern aspects are wettest due to orographic rainfall and mist driven by Indian Ocean currents. Drier western flanks tend to support deciduous woodland rather than moist forest assemblages, while grassland and heathland are common on the uppermost montane plateaus. Northern blocs are generally recognised to have two distinct peaks in rainfall: short rains from March to May and heavier rains from October to December. In the south, one rainy season prevails from December to April. East Usambara and Uluguru experience the most benign dry seasons, with some eastern aspects perhumid (> 100 mm/month). Drier spells are most prolonged and intense on western margins of Ukaguru, Rubeho and Udzungwa.
Distribution and endemism
In work led by Roy Gereau (Missouri Botanical Garden), the ecoregion definiton is being used to produce a definitive plant checklist of distribution and endemism. At the last count (2014/01), a total of 4066 indigenous vascular plant species (4996 plant taxa including species, subspecies and varieties) were known from the EAM. Of these, 508 species (609 taxa) have been found nowhere else on Earth, 281 species are endemic to a single mountain bloc, and 486 species (12%) have been assessed in a threatened category for the IUCN Red List.
In an early analysis of the world’s hotspots of biodiversity, Myers (1990) described the EAM as containing 1600 plant species, of which 535 endemic (based on Lovett 1988), equating respectively to under- and over-estimates of 61% and 6%. The latter was remarkably accurate given the data available at the time, but the inferred level of endemism was 2.5 times higher than the current estimate (33% cf. 13%), and not all the blocs were included (e.g. Taita Hills).
One of the highest projections of plant endemism in the EAM comes from Lovett and Wasser (1993), who suggested there may be 800 plant species found nowhere else. Twenty years on, many publications and websites still quote 800 plant species endemic to the EAM, alongside a wide range of estimates for forest and mountain area. The ecoregion definition presented here, combined with rigorous taxonomy, should end such confusion by providing a consistent spatial platform upon which the state of knowledge can be continually updated.
Ecosystem services

The ecoregion definition is the spatial basis for analyses conducted by Valuing the Arc, an international programme to map and value ecosystem services flowing from the EAM.
People in the mountains benefit from provisions such as firewood and charcoal for energy, building materials (poles and thatch), medicines and food (fruit, tubers, honey and bushmeat). For many, the forests and woodlands have spiritual, cultural and historical meaning. Beyond the ecoregion boundary, people benefit from the provision of charcoal and timber, and from the regulation of hydrological flows to downstream agricultural areas and major population centres, where the water is used for hydroelectric power generation, drinking and industry. Globally, society benefits from the capacity of woody biomes in the EAM to mitigate climate change, through the carbon sequestered and stored in their biomass.
Further reading on Valuing the Arc: Arc Journal Special Issue
Further reading on the EAM: http://www.easternarc.or.tz/
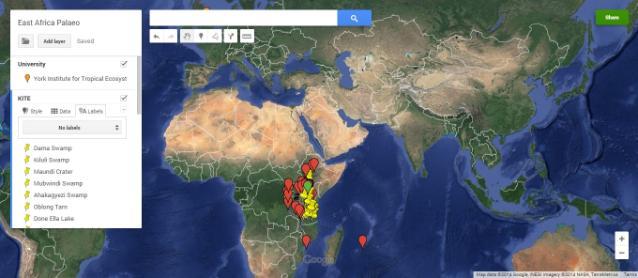
Palaeoenvironmental Sites
This map shows many of the palaeoenvironmental sites published from East Africa and includes a list of sites and associated references analysed at KITE.
Clicking the map will launch an interactive Google Map that can be used to locate sites and associated publication references.
External Data Links
Freely available data for environmental research in Africa. Help to populate this resource by emailing suggestions and corrections to environment-kite@york.ac.uk
General Portals
- AfricaMap
- African Development Bank Group (AfDB)
- AfSIS MODIS Data Sets
- Atlas of the Biosphere
- Biota-Africa Data Portal
- DIVA-GIS
- FAO GeoNetwork
- Copernicus Global Land Service
- Google Earth Engine
- KCL Geodata Portal
- LandsatLook Viewer
- NASA Reverb
- ORNL DAAC Spatial Data Access Tool (SDAT)
- POSTEL
- SERVIR Interactive Mapper
- UN Environmental Data Explorer
- USGS Earth Explorer
- World Resources Institute (WRI)
- WorldGrids.org
Biodiversity & Taxonomy
- African Plants - A Photo Guide
- African Plant Database
- AmphibiaWeb
- Biodiversity Hotspots
- Catalogue of Life
- Encyclopedia of Life
- Global Biodiversity Information Facility (GBIF)
- IUCN Red List of Threatened Species
- KEW Species Browser
- Global Population Dynamics Database (GPDD)
- InfoTree (information about trees, woods and forests)
- Kenya Reptile Atlas
- Lifemapper
- MammalDIET (diet preferences of mammals)
- Map of Life
- MoveBank
- OneZoom Tree of Life
- PanTHERIA (database of extant & recently extinct mammals)
- The Plant List (working list of all plant species)
- Plant Resources of Tropical Africa (PROTA)
- Species Link
- Tanzania Biodiversity Information Facility (TanBIF)
- Tanzania Mammal Atlas Project
- Tanzania Tree Species Checklist
- Tanzanian Birds
- Tree of Sex (database of sexual systems)
- Tropical Ecology Assessment & Monitoring Network (TEAM)
- Tropicos (Missouri Botanical Garden)
- TRY: Plant Trait Database
Climate, Weather & Fire
- AFRICLIM: high resolution climate projections for Africa
- Africa Rainfall Estimates (RFE, NOAA Climate Prediction Center)
- aWhere Weather
- Climate Hazards Group InfraRed Precipitation with Station data (CHIRPS)
- Climate Information Portal (CIP)
- Climate Vulnerability Monitor
- climateprediction.net
- CliMond: global climatologies for bioclimatic modelling
- Coordinated Regional Climate Downscaling Experiment (CORDEX)
- CGIAR Climate Analogues Tool
- CRU Climate Data
- Energy products from Copernicus (canopy reflectance, albedo, LST)
- ERA-Interim Project
- Fire Information for Resource Management System (FIRMS)
- Global Aridity and PET Database
- Hadley Centre
- International Surface Temperature Initiative
- IRI/LDEO Climate Data Library
- Met Office Limited Area Model for Africa (Africa-LAM)
- microclim: Global Estimates of Hourly Microclimate
- MODIS Land Surface Temperature & Emissivity (MOD11A2)
- NASA Precipitation Measurement Missions (TRMM & GPM)
- OMI/Aura Surface UVB Irradiance and Erythemal Dose (OMUVBG)
- Palaeoclimate Modelling Intercomparison Project Phase II (PMIP2)
- PERSIANN Rainfall
- TAMSAT Climatologies
- TRMM Rainfall Climatology & Derivatives
- World Bank Climate Change Knowledge Portal
- WorldClim
Demographics, Infrastructure & Governance
- Africa Development Indicators (World Bank)
- Africa Infrastructure Knowledge Program (AIKP)
- AidData (open data for international development)
- Digital Observatory for Protected Areas (DOPA)
- GeoHive (census datasets)
- Global Administrative Areas (GADM)
- Global Hunger Index Data
- Global Roads (gROADS)
- Gridded Population of the World
- Land Matrix (public database on land deals)
- LandScan (gridded population)
- Languages of Africa (Ethnologue)
- Map Library
- Measure Demographic & Health Surveys (DHS)
- Mining Cadastre Maps (www.flexicadastre.com/[country], e.g. Tanzania)
- OpenStreetMap
- PADDD Tracker (protected area montioring)
- Palm Watch - Africa (monitoring oil palm expansion in the Congo Bain)
- ProtectedPlanet
- UN World Population Prospects
- World Database on Protected Areas (WDPA)
- WorldPop (gridded population, including AfriPop)
Land Use & Vegetation
- European Space Agency GlobCover Portal
- FAO Africover
- Finer Resolution Observation & Monitoring of Global Land Cover (FROM-GLC)
- Geo-Wiki Project
- Global Database of Field-observed Leaf Area Index
- Global Forest Disturbance Alert System (GloF-DAS)
- Global Forest Canopy Height
- Global LAI Project
- Global Land Cover 2000
- Global Land Cover Facility (GLCF)
- Global Land Cover SHARE database (GLC-SHARE)
- Global Forest Change
- KITE Leaf Area Index for East Africa
- LUGE datasets (Land Use and Global Environment)
- MODIS Global Disturbance Index (MGDI)
- MODIS Land Cover Type (MCD12Q1)
- MODIS Land Cover Dynamics / Vegetation Phenology (MCD12Q2)
- MODIS Land-Water Mask (MOD44W)
- MODIS Leaf Area Index / FPAR (MCD15A3)
- MODIS Primary Productivity: Gross (MOD17A2) and Net (MOD17A3)
- MODIS Spectral Vegetation Indices (MOD13Q1)
- Potential Natural Vegetation of Eastern Africa
- Vegetation products from Copernicus (LAI, FAPAR, NDVI etc)
Soil, Carbon & Topography
- African Pollen Database
- Africa Soil Profiles Database (AfSIS)
- AfSIS Soil Property Maps at 1km
- Digital Soil Map of the World (DSMW)
- Eastern Arc Mountain Boundaries, Tanzania & Kenya
- Flow Accumulation/Direction & Topographic Wetness Index
- Global Carbon Maps (Ecometrica)
- Global Carbon Atlas
- Global Digital Elevation Model (G-DEM ASTER)
- Global Multi-Resolution Topography Data Portal (GMRT)
- GlobAllomeTree (web platform for allometric equations)
- Gridded Bathymetry Data
- Harmonized World Soil Database (HWSD)
- ISRIC SoilGrids 1km
- ISRIC African SoilGrids 250m
- Soil Water Index (Copernicus)
- SRTM 30m Digital Elevation Data (USGS)
- SRTM 90m Digital Elevation Data (CGIAR-CSI v4)