Time-Averaged GED at the University of York
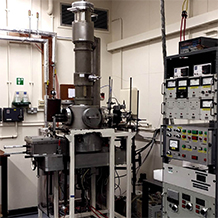
In 2016/7, the Wann Electron Diffraction Group recommissioned and recalibrated the last remaining time-averaged gas electron diffraction (GED) instrument in the UK; this instrument was formerly housed at the University of Reading and now has a permanent home at the University of York. The instrument, originally commissioned some time in the mid-1960s, was developed in-house and built upon by many generations of researchers. This is the case for all GED instruments worldwide. Our instrument is dedicated to the study of the ground-state nuclear structures of isolated molecules in the gas phase via GED - here they are free from distortions that can arise as a consequence of intermolecular interaction.
|
Features of the University of York GED instrument:
|
|
Overview of the GED Experiment
A typical GED experiment is outlined in the diagram and text below.
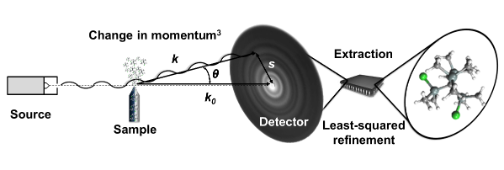
Electrons generated via thermionic emission at the tip of a hot tungsten hairpin filament are accelerated towards the diffraction chamber by a large DC voltage of some tens of kV, producing a continuous electron beam. Inside the diffraction chamber, the electron beam interacts with gas-phase molecules delivered by an effusive or pulsed nozzle. Most of the electrons in the electron beam pass straight through and do not interact with the molecular beam; these electrons are collected by a beam stop positioned in front of the detector. A small fraction of electrons are elastically scattered (to a good approximation), interfere with other scattered electrons, and impact the detector, contributing to the formation of an electron diffraction pattern. These patterns are read out and extracted to give a molecular intensity curve (MIC). The MIC is compared against simulated MICs generated from a geometrical molecular model in combination with high-level ab initio calculations and the geometric parameters in the model are refined using a least-squares approach until the best fit possible to the experimental MIC is attained.
Overview of the Theory of GED
The wavelength of an electron can be calculated using the de Broglie equation:
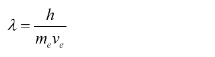
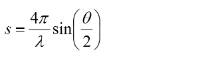
in which h is the Planck constant and me and ve are the mass and velocity of the electron, respectively. With high enough acceleration voltages, the wavelength of the electron becomes comparable to the internuclear spacing in most molecules and can be used for diffraction. Assuming purely elastic scattering events, the scattering vector s is related to the scattering angle θ as follows:
The intensity of scattering as a function of s is given by the Wierl equation:
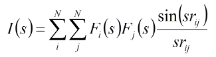
where Fi(s) and Fj(s) are the scattering factors for a pair of nuclei i and j, respectively, and rij is the distance between those nuclei. The scattering intensities are recorded experimentally as diffraction patterns which contain the convoluted contribution from all pairs of nuclei i and j in the molecule. An experimentally-acquired gas electron diffraction pattern appears as concentric rings due to the orientational disorder of molecules in the gas phase. The diffraction pattern is read out and radially averaged to produce an MIC, an example of which is given below.
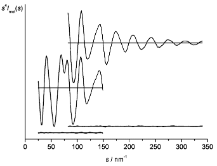
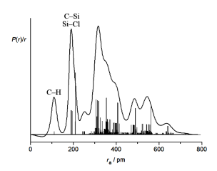
The MIC can be described as a convolution of sine functions (one for each pair of nuclei i and j) and therefore a Fourier transform can be used to convert the MIC into a radial distribution curve (RDC) which contains a peak for each internuclear distance, rij, within the molecule. This is an incredibly useful way of visualising electron diffraction data in an intuitive manner.
Sample Submission Guidelines for GED
The Wann Electron Diffraction Group are presently accepting samples for structural determination in the gas phase via GED; current and future collaborators are encouraged to contact Dr. Derek Wann (derek.wann@york.ac.uk) directly if they would like to submit a sample for analysis. This page outlines some of the practical considerations and limitations of GED as a tool for structural analysis; collaborators are encouraged to take note of this and the sample requirements/information we require before the GED experiment can be carried out.
Structure Guess:
Structural solutions via GED generally require input from theoretical calculations and an initial guess for the structure - the latter is necessary for constructing a geometric model against which the experimental data is refined. GED is not a black-box technique; very little can be done if it is not possible to suggest a structure or to obtain one from theoretical calculations. An initial guess for the structure is required and if theoretical calculations have been carried out and these are available, they are of high value since it saves time - these then need not be done in-house. The construction of the geometric model is made simpler if the structure has symmetry - the higher the better! 'Floppy', or conformationally-loose, compounds are very difficult to solve the structures of via GED and it is not recommended to submit such samples for analysis.
Sample Purity:
GED cannot, in principle, be used to determine the structure of a specific molecule within a mixture of many; any impurity in the sample provided can, and likely will, affect the quality of the structure obtained at the end of the refinement procedure. It is imperative that the sample is >95% pure and that no significant impurities can be detected via NMR; if possible, an assigned NMR spectrum is of value.
Sample Volatility:
GED data can, in principle, be acquired for any sample that can be evaporated or sublimed at an experimentally-accessible temperature. The University of York GED instrument is fitted with a heated nozzle assembly that allows data to be acquired up to approximately 400 °C (673 K). Typically a vapour pressure of approximately 5 - 10 mbar is required at the experimental temperature to acquire high-quality diffraction data; higher vapour pressures are not problematic as the gas flow can be regulated but lower vapour pressures are, and it is not uncommon in these cases to observe no detectable diffraction at all. It can be difficult to measure the vapour pressure and so we do not require this information, but if it can be obtained it is of high value. If it cannot be obtained, an approximate guess of the vapour pressure and how it might change as a function of temperature is useful to have. The temperature required for volatalisation is the most important information that you can provide us with!
Sample Stability:
It is a given that the sample submitted for study must be stable at the experimental temperature; for this reason, decomposition temperatures, if unexpectedly low, are highly valued and melting point/boiling point data is mandatory, provided it can be obtained. Instability in air is not problematic as long as we are made aware; samples can be handled under an atmosphere of nitrogen if necessary.
Sample Quantity:
GED data will routinely be acquired at two nozzle-to-image-plate distances (collecting electrons scattered at both large and small angles) so sufficient sample should be provided for at least three experiments; one temperature/gas flow/exposure calibration experiment and two production-run experiments, one at each nozzle-to-image-plate distance. An experiment typically uses ~100 mg of sample and so approximately 250 mg is the absolute minimum quantity of sample that will be accepted, but the more the better!
Handling Instructions:
Samples should be packaged with appropriate documentation of hazards related to handling, an approximate lifetime for the sample (if appropriate) and storage instructions.