3.1.1 Identifying sensing deviations
Practical guidance - cross-domain and automotive
Maritime guidance is highlighted
Authors: ALADDIN demonstrator project
Summary
This Body of Knowledge entry describes guidance to identify sensing deviations for robotic and autonomous systems (RAS) and design appropriate autonomous anomaly detection solutions.
Who this guidance is for:
- Condition monitoring engineers
- RAS operators
- RAS designers
Background
Correct sensing of the RAS’ state and the surrounding environment is fundamental for the safe operation of RAS. However, despite the designer’s best efforts, RAS can malfunction during operation, as they develop faults. Therefore, it is critical to design RAS with embedded autonomous systems to correctly identify anomalous behaviour so that suitable corrective actions can be taken and the RAS’ maintenance policy can be informed. Identifying unexpected performance based on sensor readings is key to producing an effective anomaly detection system.
Regulations for condition monitoring systems can be found in the ISO standards 13372:2012 [1] and 26262-1:2018 [2] for machines and road vehicles, respectively. This Body of Knowledge entry describes best practices for the real-time identification of sensing deviations of RAS to assure their operations. The proposed solutions are data-driven and have been developed for and tested with Marine Autonomous Systems (MAS) and in particular underwater gliders, although they can be transferred to any other RAS applications thanks to their generality.
Stage input and output artefacts
Required input/existing knowledge:
- List of all sensors on the RAS – the list should clearly label any redundant sensors on over-observed systems
- Signal output from all sensors, including both readings and the associated time stamps, synced for the RAS
- Knowledge of the dynamics of the RAS (desirable, especially for under-observed systems)
- Failure Mode Effect Analysis (FMEA) for the RAS (desirable), which can be completed according to the IEC 60812:2018 standards [3]
- Hazard and Operability study (HAZOP) for the RAS (desirable), which can be completed according to the IEC 61882:2016 standards [4]
- Formal description of the baseline RAS behaviour
- Metadata (e.g. calibration, system configuration, deployment reports or operator logs) to enable understanding of wider context
- Training and validation datasets for baseline RAS behaviour – data from multiple RAS within a fleet would be ideal
- Testing datasets for anomalous RAS behaviour – data of a wide range of anomalies would be ideal.
Assumptions:
- Sensing requirements, as defined in Section 2.2.1.1 of the Body of Knowledge, are met, i.e. the installed sensors are appropriate for the RAS
- The incoming volume of data is manageable in real-time with the installed processing power.
Expected outputs:
- The system is able to autonomously detect anomalies and inform the operator accordingly.
Procedure and activities
Figure 1 shows an overview of a procedure that can be used to identify sensing deviation for a RAS. In this section, further details are provided for each step.
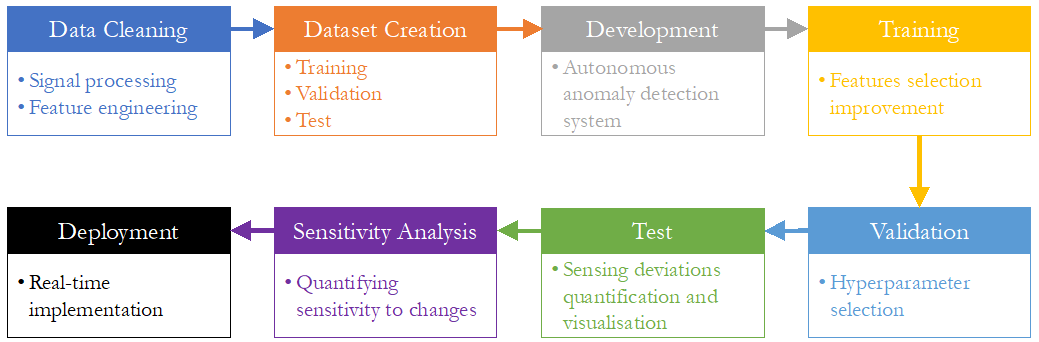
Figure 1 – Summary of the procedure to identify sensing deviations of RAS.
1. Data cleaning: the following steps need to be performed to clean both the training, validation and test datasets as well as the RAS stream data during deployment.
- Signal processing and data treatment (e.g. [5], [6]), including filtering, antialiasing, data augmentation if signal is lost, and resampling of the signals from all sensors for the same time stamps.
- Feature engineering:
- Data fusion to combine the signals from multiple sensors
- Design observers (or estimators) to generate additional virtual signals from dynamic models. This is critical for under-observed systems, like Autonomous Underwater Vehicles (AUVs).
- AUV example: The buoyancy force acting on underwater vehicles can be obtained from the signals of the net volume of the vehicle and the water density, pressure (compressibility) and temperature (expansivity).
- In some applications, the RAS can spend significant time in steady-state operations (e.g. steady-state flight at a constant speed). In this case, removing transient effects from the data can be considered to reduce the computational cost and improve real-time performance, although fully dynamic effects can be important for most RAS.
2. Dataset creation: creation of suitable datasets for the development of the anomaly detection system.
- Training dataset – baseline RAS operating conditions
(1.0×10⁵ samples used for the case study of underwater gliders [7])
- Validation dataset for hyperparameter selection – baseline RAS operating conditions
(1.0×10⁵ samples used for the case study of underwater gliders)
- Test datasets – baseline RAS operating conditions in addition to a range of different anomalies, trying to include all the anomalies identified by the FMEA if the data is available (4.3×10⁴ samples used for the case study of underwater gliders for seven different anomalies).
3. Development: the anomaly detection system is designed and developed according to the method described in the next section and in references [7].
4. Training: the anomaly detection system is trained using the previously prepared training dataset. Different signals can be selected as input during this stage to assess improvements in performance (prediction accuracy and computational cost).
5. Validation: the hyperparameters of the network (e.g. size of the Deep Neural Networks (DNNs)), are selected with a sensitivity analysis to improve prediction accuracy and computational cost and prevent overfitting on the validation dataset.
6. Test: the ability of the anomaly detection system in correctly identifying and labelling baseline and anomalous behaviour is assessed for the test datasets. In particular, sensing deviations are quantified and visualised (see an example in Figure 2).
7. Sensitivity analysis: handling large quantities of data in real-time is challenging or there can be constraints associated with data transmission (e.g. if undertaken by satellite). Therefore, the data needs to be decimated, i.e. collected at larger time steps, during actual deployment. The sensitivity analysis on the data decimation settings indicates whether the proposed anomaly detection system is insensitive to the selected sample time in the data decimation.
For underwater gliders, the proposed anomaly detection method is insensitive to the data decimation settings, suggesting its robustness in Near-Real-Time (NRT) anomaly detection.
8. Deployment: the anomaly detection system’s architecture is updated to enable its real-time deployment for the RAS operations.
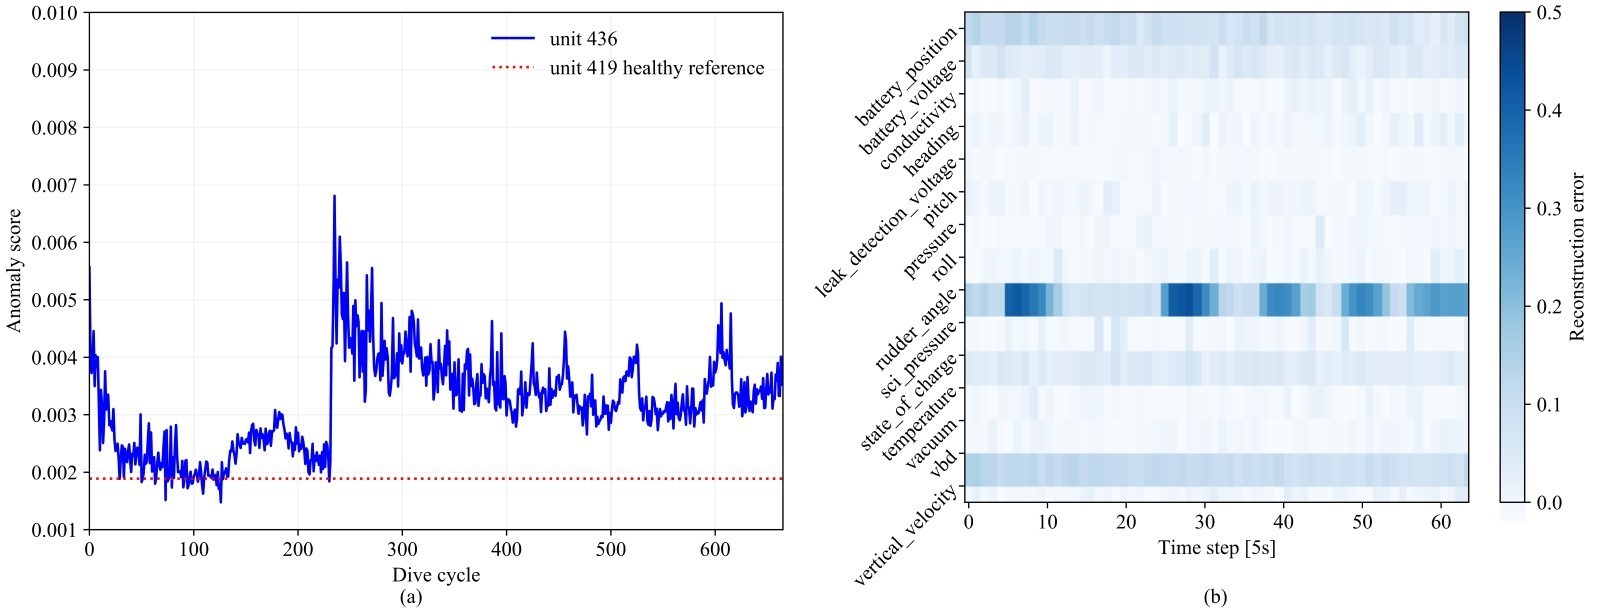
Figure 2 - An example of anomaly detection results of an underwater glider that lost one of its wing: (a) anomaly scores compared against the baseline and (b) sensing deviations quantified and visualised [16]
Method
RAS operating in both steady and dynamic operations can have different numbers of sensors in different applications and can also be under-observed with restricted data transmission capability.
An example of a RAS operating in steady-state condition is an underwater glider during flight, whereas an example of a RAS in dynamic operations is the glider at the bottom of the dive, using its actuators to start the ascent.
The method proposed in this study has prioritised generalisability and transferability for RAS, such that multivariate time series data from a variable number of sensors with different sampling rates can be augmented in a standardised data structure which can be fed to the DNN of the BiGAN for anomaly system training, validation and testing (Figure 3). Multi-dimensional matrices are used to store the multivariate time series data from RAS to capture the operational features (including both steady and dynamic states) within a short period. Multiple data patches in matrices can be sampled from a variable length of operational cycles to reflect the anomaly levels with flexibility.
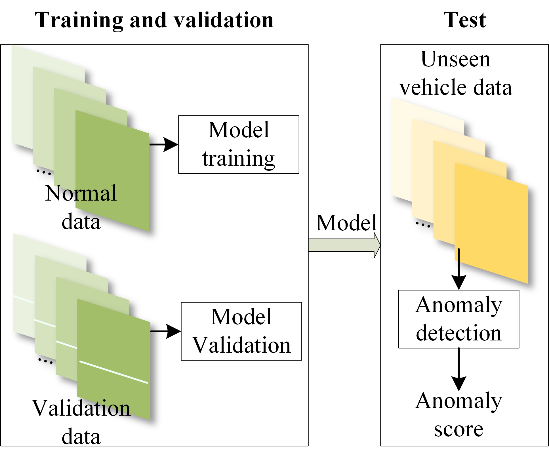
Figure 3 - Workflow of unsupervised anomaly detection using GAN for underwater gliders.
Figure 4 shows the proposed anomaly detection framework using BiGAN. In the training phase, the pre-processed healthy deployment datasets are applied to train the generator G, encoder E and discriminator D concurrently. Assistive hints are applied to guide the generator G and encoder E training periodically. In the test phase, the reconstruction error and discriminator feature hint error jointly represent the degree of an anomaly.
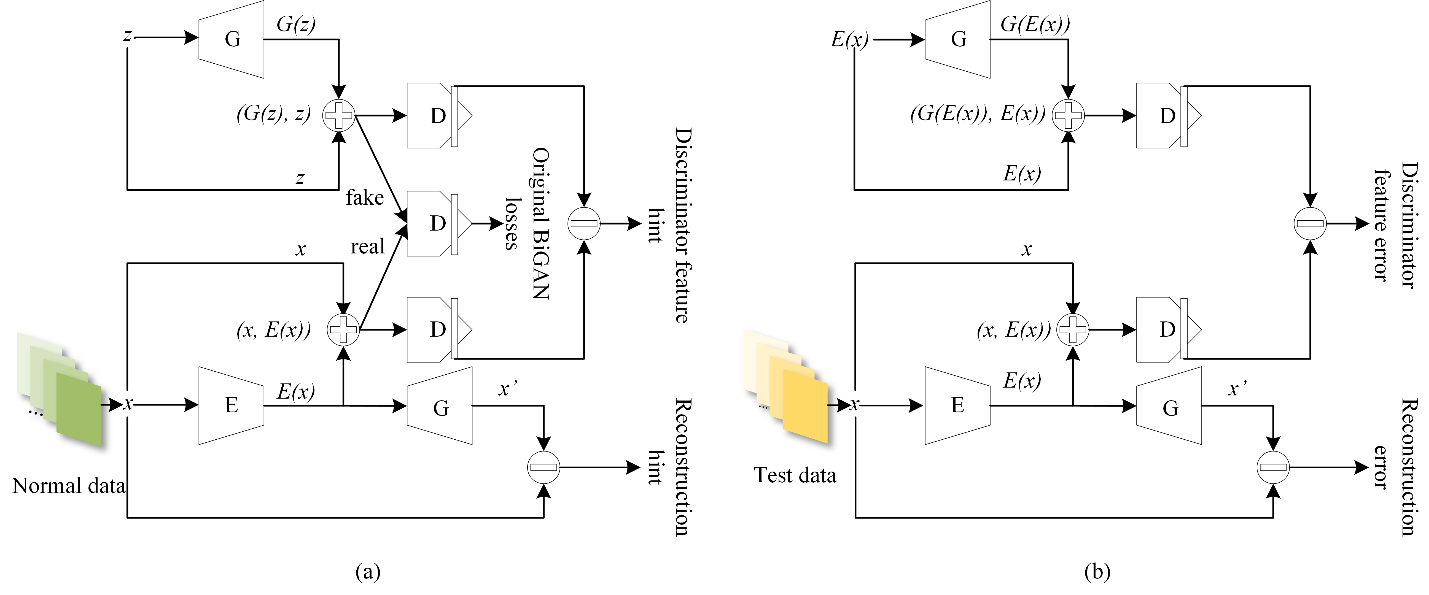
Figure 4 - Anomaly detection using BiGAN for MAS: (a) training using normal data and (b) testing using unseen deployment data.
Advantages of the approach
- The approach is general so that the anomaly detection method can be transferred to different technologies or even sectors, as long as the model-based virtual sensors are updated by the designer for the specific field of application and the input and output signals to the BiGAN updated;
- The approach is scalable so that its application can be easily scaled to large fleets of RAS.
Limitations of the approach
- Approach needs large quantities of data for existing systems. The training dataset needs to be large enough to represent normal operations.
1.0×10⁵ samples have been used to train the anomaly detection system for underwater gliders, with 1.0×10⁵ samples used for validation 4.3×10⁴ for testing [7].
- Training, validation and testing require significant computational resources and time. Hence, at this stage, these steps should be undertaken offline, if possible on computer clusters. Conversely, once trained the system has a low computational cost, so it can be applied in real-time on the RAS, depending on the time step length and the number of real and virtual signals.
The training time under current settings is 51 min on a Nvidia V100 GPU for the underwater gliders [7].
- For new systems, dynamic models can be used to generate synthetic data and experimental tests for validation; however, domain adaption is then necessary to transfer the learning to the full-scale prototype.
References
[1] ISO, 13372:2012(en): Condition monitoring and diagnostics of machines, 2012.
[2] ISO, 26262-1:2018(en): Road vehicles — Functional safety, 2018.
[3] IEC, 60812:2018: Failure modes and effects analysis (FMEA and FMECA), 2018.
[4] IEC, 61882:2016: Hazard and operability studies (HAZOP studies) - Application guide, 2016.
[5] National Instruments, “Signal Processing Toolset User Manual”, Part Number 322142B-01, 2001.
[6] Texas Instruments, “Signal Processing Examples Using TMS320C64x Digital Signal Processing Library (DSPLIB)”, Application Report SPRA884A, 2003.
[7] P. Wu, C. A. Harris, G. Salavasidis, A. Lorenzo-Lopez, I. Kamarudzaman, A. B. Phillips, G. Thomas and E. Anderlini, “Unsupervised Anomaly Detection for Underwater Gliders Using Generative Adversarial Networks”, Engineering Applications of Artificial Intelligence, under review, 2021.
Contact us
Assuring Autonomy International Programme
assuring-autonomy@york.ac.uk
+44 (0)1904 325345
Institute for Safe Autonomy, University of York, Deramore Lane, York YO10 5GH
Related links
Download this guidance as a PDF:
Contact us
Assuring Autonomy International Programme
assuring-autonomy@york.ac.uk
+44 (0)1904 325345
Institute for Safe Autonomy, University of York, Deramore Lane, York YO10 5GH
Related links
Download this guidance as a PDF: