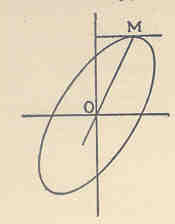
Figure 1: Bravais's geometric discovery of the
normal surface
[Reprinted from Walker, 1929]
Daniel J. Denis
York University
Paper presented at the 61st Annual Convention
of the Canadian Psychological Association
Ottawa, Canada on Thursday, June 29, 2000
Sir Francis Galton is commonly regarded as the founder of the statistical techniques of correlation and linear regression (e.g., see Millar, 1996). And although he is best known for his development of correlation, most of his work on inheritance led to the development of regression, from which correlation was a somewhat ingenious deduction. The actual mathematical development of correlation played a much more prominent role in the work of Karl Pearson (Stigler, 1986).
The primary goal of this paper is to trace any pre-Galton statistical conceptions of correlation and regression theory, and consider whether these might have contributed significantly to either Galton's discovery or to today's conception. A secondary goal is to provide a rationale for the conclusion of the first. That is, if correlation and regression have been in work prior to Galton, why is he regarded as founder? Furthermore, it will be of interest to distinguish between the main elements present in work done before Galton, and the elements present in Galton's own discoveries. I will aim to evaluate the unique contribution of Galton to the statistical theory of correlation and regression, given that, as will be seen, the mathematical "roots" of the techniques existed quite some time before him.
The paper is divided into three parts. Part one overviews the development of the method of least squares, credited widely, although not unanimously, to Adrien Marie Legendre (1752-1833). The importance of this development in relation to later regression cannot be overstated. As Pearson (1920) has claimed, to understand the origin of the correlational calculus, we must begin with least squares. It was this exact method that gave regression the mathematical tool necessary for teasing out a "best" value given numerous observations. The issue then becomes one of determining why regression is traced to Galton and not Legendre. Stigler (1986) so aptly observes the "puzzle" that is apparent:
The second part of the paper will focus on early conceptions of correlation, not the correlation observed empirically by Galton, but the mathematical correlation developed by error theorists some 40 to 50 years before Galton. As will be seen, the name of Auguste Bravais is often associated with the foundation of correlation theory. I will attempt to answer whether this claim has merit, and if so, whether it contributed at all to the correlation later developed by Galton.
The third part of the paper will comprise of a brief overview of Galton's discovery of regression, through his study of heredity. The details of his discovery have been well-documented elsewhere (e.g., see Fancher, 1989; Stigler 1986; Walker, 1929) and so only a brief overview will be provided, sufficient enough to provide the "basics" for relating Galton's correlation to the theoretical correlation developed previously by the error theorists.
Part I: The Calculus of Observations
In order to gain a full appreciation of the historical origin and development of correlation and regression, it is crucial to first understand the concept of "error" and error theory as used in statistics. The term "error" as traditionally used in mathematics, is defined by Oxford as "the quantity by which a result obtained by observation or by approximate calculation differs from an accurate determination" (p. 378). Exactly how this "accurate determination" is itself established is a topic more philosophical than statistical or mathematical. However, assuming an "accurate determination" is obtainable, the concept of error is one which deals with any deviation from this true value. The first use of "error" (i.e., in the mathematical/statistical sense) was in 1726 in "Gregory's Astron. I" (presumably David Gregory, Astronomiae Physicae & Geometricae Elementa, Geneva: Bousquet and Socios 1726 - P.M.L.). In this work, the term was used to represent the deviation of a celestial body from the mathematical representation of that body. A more current and general statistical defining of "error" yields the following:
a = x - y + z + E
b = x' - y' + z' + E
c = x'' - y'' + z'' + E
d = x''' - y''' + z''' + E
Such a set of equations would be relatively easy to deal with if there were an equal number of unknowns. For instance, if w, x, y, z were the variables of a four-equation problem, then linear methods such as "Cramer's Rule" or "Gaussian Elimination" (Anton & Rorres, 2000) could be used to solve for w, x, y and z respectively. The problem facing eighteenth-century astronomers lay in solving for "n" unknowns given "n + N" equations. As of the eighteenth century, there was no ideal solution. In terms of understanding the problem in relation to astronomical investigations, it can be described as summing many measurements of a given phenomenon (e.g., the shape of the earth), taken under various conditions (e.g., similar, yet not identical instrumentation), and desiring this set to represent the "best" numerical value of the aggregate of these observations. As mentioned, taking the mean of the observations was common by the eighteenth century, but it did not provide a systematic method for "harmonizing" or "balancing" as Legendre would later say, the discrepancies from the mean found in each measurement. Furthermore, as noted by Stigler (1986), astronomers were wary in combining observations made under differing circumstances, fearing that errors in one observation would "contaminate" errors in other observations, and that the errors would multiply, not somehow compensate each other's influence. What was needed was a method that would account for all observations, and provide a "rule" for controlling the variation (i.e., error) around each one.
Legendre is credited with providing a method whose historical record of employment suggests it to be the overwhelmingly most preferred solution to combining observations -- the method of least squares[1]. As Stigler (1986) notes, the method not only casually gained acceptance, but was readily embraced as a solution to the problem of combining observations: "The rapid geographic diffusion of the method and its quick acceptance in these two fields [i.e., astronomy and geodesy], almost to the exclusion of other methods, is a success story that has few parallels in the history of scientific method" (p. 15). What was Legendre's ingenious solution? Legendre suggested to sum the squared deviations around each mean, which would then serve to provide a grand estimate of the error variance around the total number of observations. As Legendre claimed, such a method would effectively "balance the errors" in any given set of equations assuming their number was greater than the number of unknowns. He published the method in 1805 in a paper titled "Nouvelles méthodes pour la détermination des orbites des comètes" with a subtitled section "Sur la méthode des moindres quarrés."[2] Key to the method was the idea that in summing the squared deviations around the mean, one could be sure to have minimized the error as an "aggregate" across the total number of observations. No method up to this time assured such a consistent result, one that would always offer the "best" solution in terms of error reduction and symmetry. As Legendre himself (1805) claimed:
Part II: Early Mathematical Correlation Theory
As mentioned at the outset, a goal of this paper is to provide a brief survey of those theorists before Galton who may have discovered correlation in some form or another, or at least foreshadowed Galton's discovery. Among these include Robert Adrain, an American mathematician, who according to Walker (1929) is the first to have studied the probability of the simultaneous occurrence of two independent errors in a position of a point. In 1808, Adrain published two proofs in a paper entitled "Research concerning the probabilities of the errors which happen in making observations." Although by no means inventing correlation, the significance of Adrain's work is in noting that concentric circles exist for two sources of error and at the same time deducing the ellipses that would be formed if the sources of error were not one to one. This observation, as will be seen, describes the basic properties of the normal frequency surface of correlation.
Others have also contributed to early correlation theory. For instance, Walker (1929) cites Pierre Simon Laplace (1749-1827) and Giovanni Plana (1781-1864) as both contributing by introducing the "product term" in the equation of correlation, representing the probability of the simultaneous occurrence of two errors. Karl Friedrich Gauss (1777-1855) has also been credited by Walker as contributing to the mathematical development of the theory of correlation. However, as Karl Pearson (1920) has noted, Gauss's work lacked the idea of "organical association," what Pearson called the "fundamental conception of correlation" (p. 13). As will be elaborated on later, it is this concept of "organical association" that appears to be the defining feature differentiating the correlation developed by early mathematical error theorists, and the correlation Galton was to discover. Even so, the geometric interpretation of the correlation of the error theorists and that of Galton were more similar than they were different. To show why this is so, it serves us well to first briefly review the contribution of a figure who is generally credited, of all error theorists, in laying the foundation of mathematical correlation -- Auguste Bravais.
Auguste Bravais (1811-1863), professor of astronomy
and physics, is probably best known for his work in crystallography (Nelson,
1998). With respect to error theory, he is best known for a paper he wrote
in 1846 titled "Analyse mathématique sur les probabilités
des erreurs de situation d'un point" [translated: "Mathematical analysis
on the probability of errors of a point"]. This work is renowned for being
the very first mathematical exposition of the theory of correlation. Pearson
(1896), later to recall these remarks, said that it was Bravais who first
discussed the fundamental theorems of the correlational calculus. In his
famous paper of 1846, Bravais, mathematically, not empirically, found the
equation of the normal surface for the frequency of error. Using both analytic
and geometric methods, Bravais also essentially found what would eventually
be coined "regression line." He did so through investigating how the various
elliptical areas of the frequency surface vary given various directly
observed quantities. Through this, he found the line of regression, but,
in essence, did not realize it, and thus could not "make the leap" (Walker,
1929) necessary to claim the discovery of correlation or regression. The
following figure shows geometrically what Bravais found.
Figure 1: Bravais's geometric discovery of the
normal surface
[Reprinted from Walker, 1929]
What is crucial to understand is that Bravais was interested in the areas of the ellipses, and not the actual line "OM." His main thesis, contrary to what one would expect in a pure exposition of correlation, was to show how the errors accompanying the observed quantities were independent, not associated. As Pearson (1920) says of Bravais's work: "He gets the line [i.e., "OM"] which corresponds to Galton's regression-line. But this is not a result of observing x and y and determining their association, but of the fact that x and y are functions of certain independent [italics added] and directly observed quantities" (p. 32). Hence, Bravais, being more concerned in showing how to eliminate this "common error variance" clearly did not envision the idea of correlation. Indeed, as noted by Mackenzie (1981), Bravais had no reason or interest in studying any relation among observed quantities. Astronomers of the time were far more interested in the "disposing" of this common error variance, again largely due to the fear that error would multiply, not compensate, when combining observations. Referring once again to least squares, Porter (1986) explains:
Still, from our brief discussion of Bravais, it is plausible why his name is associated with correlation. For one, he was one of the first to study the existence of two or more errors, something that only few (e.g., Gauss, Plana) had done before. Second, he produced the product term for the correlation coefficient, and discovered the mathematical equation for what 30 years later was coined the regression line. Third, he discussed both of these in terms of the normal surface of correlation, and identified the varying shapes of the ellipses that would exist given varying quantities and accompanying error. Thus, in a certain sense, he "touched" on the concept of correlation, but didn't conceptualize it as such. Opposite to this is the argument that he cannot at all be credited with being the inventor of correlation. The most compelling support for this argument lies in the fact that Bravais studied the independence of these observed quantities, and not their linear association. As Walker (1929) explains: "Bravais shows beyond the possibility of misunderstanding that he had no thought of applying his theory to any field except errors in the geometric position of a point. Certainly he was not thinking of the strength of the relation between the variables, nor did he ever single this out for attention" (p. 482). Indeed, even Pearson (1920), in his "Notes on the History of Correlation," issued a correction with regards to his previous crediting of correlation to Bravais:
Part III: The Law of Error and Galton's Discovery of Regression
Today's idea of "statistical regression" is commonly traced to Galton and his observation that the mean value of an inherited characteristic deviates from the mean of the mid-parent, and "regresses" toward the mean of the population. For example, the offspring of even very tall parents would not equal the height of its parents, but rather would be slightly shorter in stature, regressing toward the mean height of the population. The central idea was that deviations in inherited characteristics could be explained by their regression toward the mean value; that extreme deviations did not produce deviations equally or more extreme, but in general, produced deviations of a lesser degree, regressing back toward the central value, the mean. However, what Galton discovered was even more significant. Through his work on charting heights, he "discovered" the normal correlational surface, that is, the surface representing the frequency of error. Up to this time, the normal surface of correlation was a mathematical theoretical entity, and nothing more. Galton's major achievement was that he made it an "empirical" reality. Before diving into the details of how this was accomplished, a brief summary of Galton's major goals, as they relate to inheritance, is in order.
Galton possessed a penchant for observations, some would even say an "obsession." In short, Galton measured everything he could, from wind direction to fingerprints, to what would form the empirical roots of his later discoveries -- physical attributes such as heights and stature. As Stigler (1986) remarks, Galton was greatly influenced by Quetelet in that he almost "rejoiced" in Quetelet's concept of a theoretical law of deviation from an average (i.e., "error theory"). Galton even appears to have foreshadowed, using the concept of the error curve, the basis of modern hypothesis-testing, that of determining whether observed values arise from a single population, or from various populations. As Stigler (1986) notes:
Figure 2: Galton's "Table of Correlation." Reprinted from Pearson (1920)
What Galton noticed next, constituted the first step towards discovering how his empirical data related to the frequency law of error. He noticed that identical values (i.e., totals of each cell), if joined by line segments, formed a series of concentric and similar ellipses, of which the centre point of these ellipses was the mean of values on the ordinate and absissa. He further found that at each point where the ellipse was touched by a horizontal tangent, all points lay in a straight line and each line was inclined to the vertical in the ratio of 2/3. Those points where the ellipses were touched by a vertical tangent also lay in a straight line but this time inclined to the horizontal in the ratio of 1/3. Galton, having little advanced mathematical training (Cowan, 1972), but still familiar with elementary probability, hypothesized that these same diagrams should be able to be reproduced by simply knowing the probable error for the parental generation, the probable error for the filial generation, and the average reversion of the filial generation on the parental generation. To test this hypothesis, Galton sent these data to J. D. Hamilton Dickson, a seasoned mathematician, to produce the distribution of error that would result from these data. To Galton's pleasure, Dickson reproduced almost identical diagrams. Cowan (1972) summarizes the significance of this event:
Conclusions
As promised at the outset, answers to questions posed earlier will now be attempted. Do pre-Galtonian conceptions of correlation and regression exist? A clear-cut answer to this question is difficult. As seen, the mathematical tools used in regression and correlation appear to have been developed before Galton. For instance, the method of least squares, developed by Legendre is precisely the tool used in calculating a regression coefficient, and hence deserves some credit in producing today's technique of regression. Furthermore, Bravais (among other error theorists) appears to have laid out the mathematics of correlation, without fully realizing he had done so. In fact, as discussed, showing that a relationship existed among variables was not of interest to the error theorists, and so they had no purpose in looking for the existence of regression and correlation. Galton on the other hand, deliberately sought out to find the mechanism of inheritance, and so discovering regression served as an aid in promoting his theory of inheritance, which further served as a political tool in his program of eugenics.
Overall, there are two main distinctions to note regarding Bravais' work and that of Galton. First, as mentioned, their purposes were different from the outset, and this is a plausible reason as to why Galton "saw" the discovery, and Bravais did not. Bravais was not in the least interested in associating two variables, but rather was more interested in showing the independence of errors. The idea of correlation simply did not fit into Bravais' purpose. As Mackenzie (1981) correctly observes: "For him [Bravais] to have done what Galton did -- examine the dependence of x and y in order to know the influence of one on the other -- would have made little sense"(p.??) Hence, one can conclude that since Bravais, or any of the other error theorists had no reason to discover correlation, none of them did. Had they had an interest in showing the dependence of variables, as Galton did, they undoubtedly would have discovered correlation, given that they had already laid down the mathematical theory necessary for such a discovery. As Walker (1929) concludes, "Any one of them might have discovered it. None of them did" (p. 92).
A second distinguishing feature between the work of Bravais and Galton is that while Bravais discovered correlation mathematically, Galton discovered it empirically. Bravais deduced the normal surface for correlation through mathematical theory, and not through actual observation of real data as Galton did. It is this element of "organical association" referred to by Pearson (1920) that effectively and decisively distinguishes Bravais's correlation from that of Galton. In short, Galton found empirically what Bravais deduced mathematically. What is perhaps most noteworthy is that Galton had little training in probability or mathematics, and thus could not have made his discoveries by these means. Hence, the only way Galton could have succeeded was through observation of empirical data, and that's the exact path he followed. As Pearson has stated, it is through the displaying of an "organical association" between real variables that Galton achieved his discovery. Once again, Bravais did nothing of the sort.
A third and final observation with regards to Bravais's work and that of Galton's is worth noting. Perhaps there is no better example in the history of statistics than the one before us to show that statistical techniques do not simply arise out of mathematical manipulation, but are often preceded by a social-political cause or other equivalent goal. Hence, in this context, the statistical technique is but a "weapon" in the pocket of artillery of the proponent. Since Bravais had no particular reason for finding the technique of correlation, he did not. Conversely, since Galton's program of eugenics and theory of inheritance relied heavily on him finding a "mechanism" of inheritance, he had all the reason and motivation for discovering the technique of regression and correlation, and so he did.
References
Adrain, R. (1808). Research concerning the probabilities of the errors which happen in making observations &c. The Analyst or Mathematical Museum, 1 93-109.
Anton, H., & Rorres, C. (2000). Elementary Linear Algebra, 8th Edition. John Wiley & Sons, Inc. New York.
Bravais, A. (1846). Analyse mathématique sur les probabilités des erreurs de situation d'un point. Mémoires présentés par divers savants à l'Académie royale des sciences de l'Institut de France, 9, 255-332.
Cowan, R. S. (1972). Francis Galton's statistical ideas: the influence of eugenics. Isis, 63, 509-528.
Fancher, R. E. (1989). Galton on examinations: an unpublished step in the invention of correlation. Isis, 80, 446-455.
Galton, F. (1888). Co-relations and their measurement, chiefly from anthropometric data. Proceedings of the Royal Society, 45, 135-145.
Legendre, A. M. (1805). Nouvelles méthodes pour la détermination des orbites des comètes. Paris: Courcier.
Mackenzie, D. A. (1981). Statistics in Britain, 1865-1930: the social construction of scientific knowledge. Edinburgh University Press: Edinburgh.
Miller, D., & Millar, I. (1996). The Cambridge dictionary of scientists. Cambridge University Press: Cambridge.
Nelson, D. (1998). Penguin Dictionary of Mathematics. Penguin Books: New York.
Oxford Dictionary
Pearson, K. (1896). Mathematical contributions to the theory of evolution, III: regression, heredity and panmixia. Philosophical Transactions of the Royal Society of London (A), 187, 253-318.
Pearson, K. (1920). Notes on the history of correlation. Biometrika,13, 25-45.
Pearson, E. S. (1978). The history of statistics in the 17th and 18th centuries against the changing background of intellectual, scientific and religious thought: lectures by Karl Pearson given at University College London during the academic sessions 1921-1933. Charles Griffin & Company Limited: London.
Porter, T. M. (1986). The rise of statistical thinking: 1820-1900. Princeton University Press: New Jersey.
Smith, D. E. (1929). A Source Book in Mathematics. McGraw-Hill: New York.
Stigler, S. M. (1986). The history of statistics: the measurement of uncertainty before 1900. The Belknap Press of Harvard University Press: Cambridge.
Walker, H. M. (1929). Studies in the history of statistical method. The Williams & Wilkins Company: Baltimore.
Footnotes
[1] Gauss has also been credited with inventing the method of least squares. According to Stigler (1986), the issue of priority between Gauss and Legendre in relation to the invention of least squares is comparable to that between Leibnitz and Newton in relation to the invention of the calculus. For details regarding Gauss and least squares, see Pearson (1920).
[2] For an English translation of this section, see Smith, D. E. (1959). A source book in mathematics. McGraw-Hill: New York.
[3] See Stigler (1986) chapter 8 for these and more Galton diagrams depicting the error curve.
Last updated January 11, 2001.